Prompts for LLMs

Prompts
W&B Prompts is a suite of LLMOps tools built for the development of LLM-powered applications. Use W&B Prompts to visualize and inspect the execution flow of your LLMs, analyze the inputs and outputs of your LLMs, view the intermediate results and securely store and manage your prompts and LLM chain configurations.
Use Cases
W&B Prompts is the solution for building and evaluating LLM-based apps. Software developers, prompt engineers, ML practitioners, data scientists, and other stakeholders working with LLMs need cutting-edge tools to explore and debug LLM chains and prompts with greater granularity.
- Track inputs & outputs of LLM applications
- Debug LLM chains and prompts using interactive traces
- Evaluate the performance of LLM chains and prompts
Products
Traces
W&B’s LLM tool is called Traces. Traces allow you to track and visualize the inputs and outputs, execution flow, model architecture, and any intermediate results of your LLM chains.
Use Traces for LLM chaining, plug-in or pipelining use cases. You can use your own LLM chaining implementation or use a W&B integration provided by LLM libraries such as LangChain.
Traces consists of three main components:
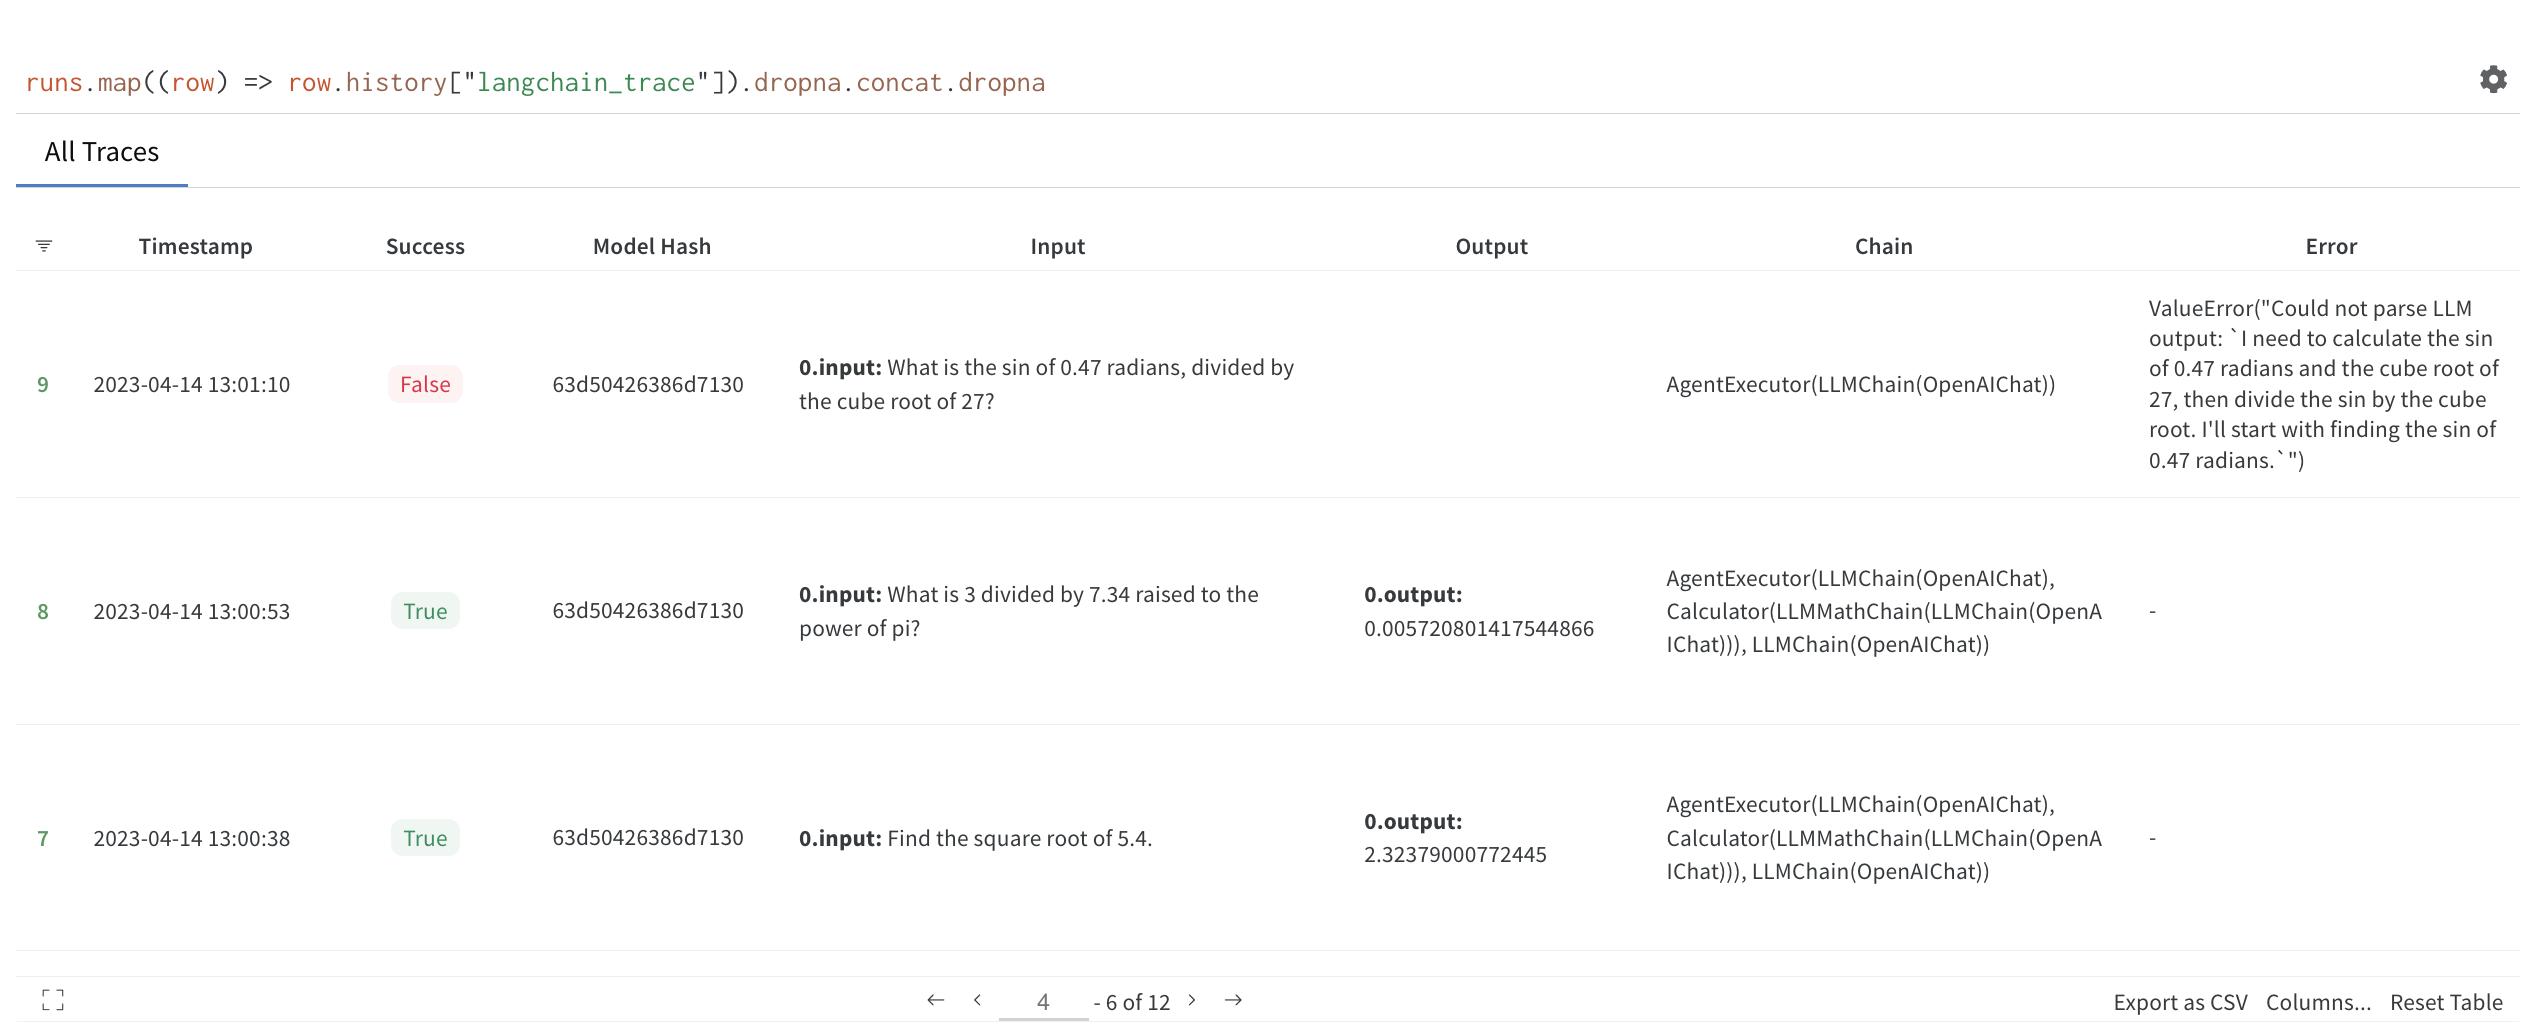
- Trace table: Overview of the inputs and outputs of a chain.
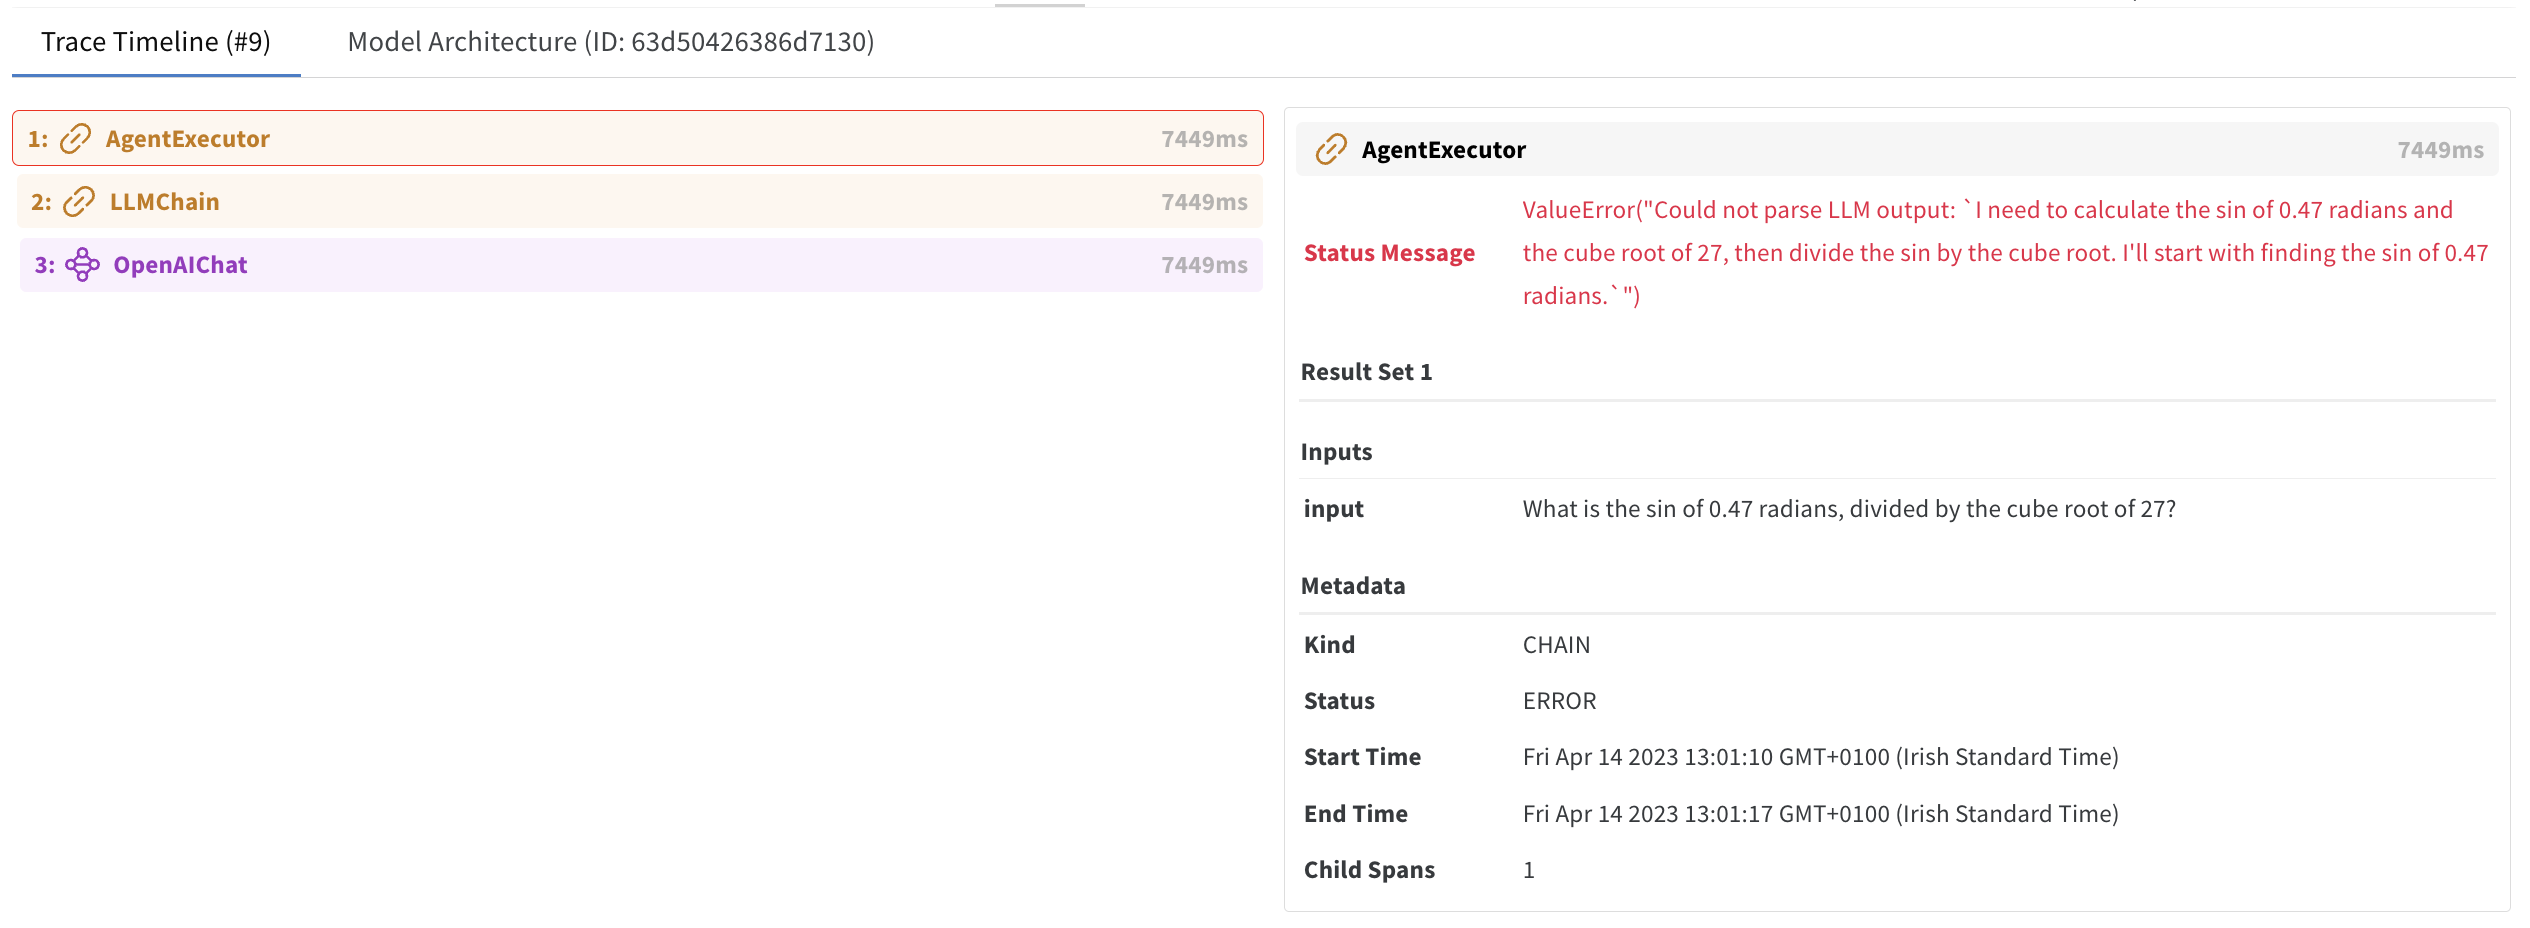
- Trace timeline: Displays the execution flow of the chain and is color-coded according to component types.
- Model architecture: View details about the structure of the chain and the parameters used to initialize each component of the chain.
Trace Table
The Trace Table provides an overview of the inputs and outputs of a chain. The trace table also provides information about the composition of a trace event in the chain, whether or not the chain ran successfully, and any error messages returned when running the chain.

Click on a row number on the left hand side of the Table to view the Trace Timeline for that instance of the chain.
Trace Timeline
The Trace Timeline view displays the execution flow of the chain and is color-coded according to component types. Select a trace event to display the inputs, outputs, and metadata of that trace.

Trace events that raise an error are outlined in red. Click on a trace event colored in red to view the returned error message.

Model Architecture
The Model Architecture view provides details about the structure of the chain and the parameters used to initialize each component of the chain. Click on a trace event to learn more details about that event.
Evaluation
To iterate on an application, we need a way to evaluate if it's improving. To do so, a common practice is to test it against the same dataset when there is a change. See this tutorial to learn how to evaluate LLM applications using W&B. Tutorial: Evaluate LLM application performance
Integrations
Weights and Biases also has lightweight integrations for:
Getting Started
We recommend you go through the Prompts Quickstart guide, which will walk you through logging a custom LLM pipeline with Trace. A colab version of the guide is also available.
Next Steps
- Check out more detailed documentation on Trace, or our OpenAI Integration.
- Try one of our demo colabs, which offer more detailed explanations of how to use Prompts for LLMOps.
- You can use existing W&B features like Tables and Runs to track LLM application performance. See this tutorial to learn more: Tutorial: Evaluate LLM application performance