PyTorch
Try in a Colab Notebook here →
PyTorch is one of the most popular frameworks for deep learning in Python, especially among researchers. W&B provides first class support for PyTorch, from logging gradients to profiling your code on the CPU and GPU.
Try our integration out in a colab notebook (with video walkthrough below) or see our example repo for scripts, including one on hyperparameter optimization using Hyperband on Fashion MNIST, plus the W&B Dashboard it generates.
Logging gradients with wandb.watch
To automatically log gradients, you can call wandb.watch and pass in your PyTorch model.
import wandb

wandb.init(config=args)

model = ...  # set up your model

# Magic
wandb.watch(model, log_freq=100)

model.train()
for batch_idx, (data, target) in enumerate(train_loader):
    output = model(data)
    loss = F.nll_loss(output, target)
    loss.backward()
    optimizer.step()
    if batch_idx % args.log_interval == 0:
        wandb.log({"loss": loss})
If you need to track multiple models in the same script, you can call wandb.watch on each model separately. Reference documentation for this function is here.
Gradients, metrics and the graph won't be logged until wandb.log is called after a forward and backward pass.
Logging images and media
You can pass PyTorch Tensors with image data into wandb.Image and utilities from torchvision will be used to convert them to images automatically:
images_t = ...  # generate or load images as PyTorch Tensors
wandb.log({"examples": [wandb.Image(im) for im in images_t]})
For more on logging rich media to W&B in PyTorch and other frameworks, check out our media logging guide.
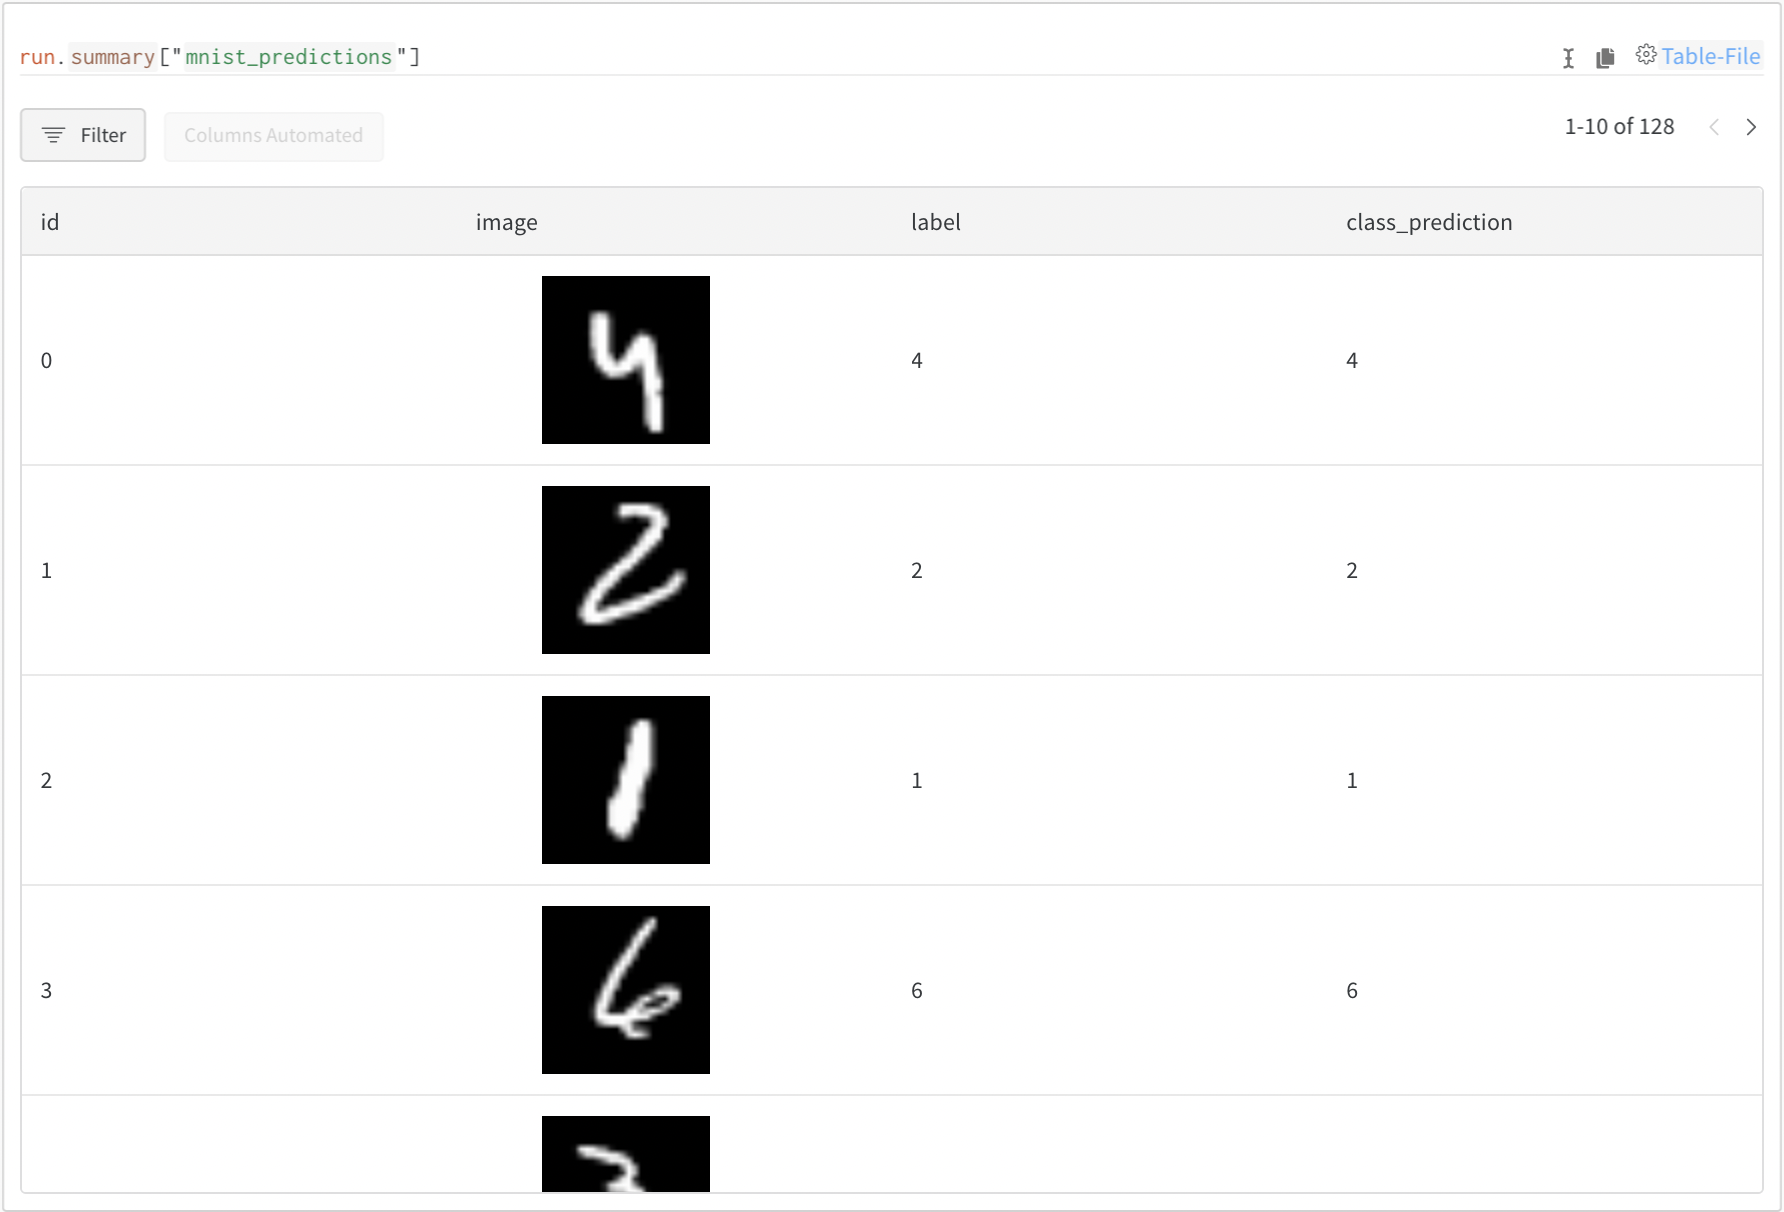
If you also want to include information alongside media, like your model's predictions or derived metrics, use a wandb.Table.
my_table = wandb.Table()

my_table.add_column("image", images_t)
my_table.add_column("label", labels)
my_table.add_column("class_prediction", predictions_t)

# Log your Table to W&B
wandb.log({"mnist_predictions": my_table})

For more on logging and visualizing datasets and models, check out our guide to W&B Tables.
Profiling PyTorch code

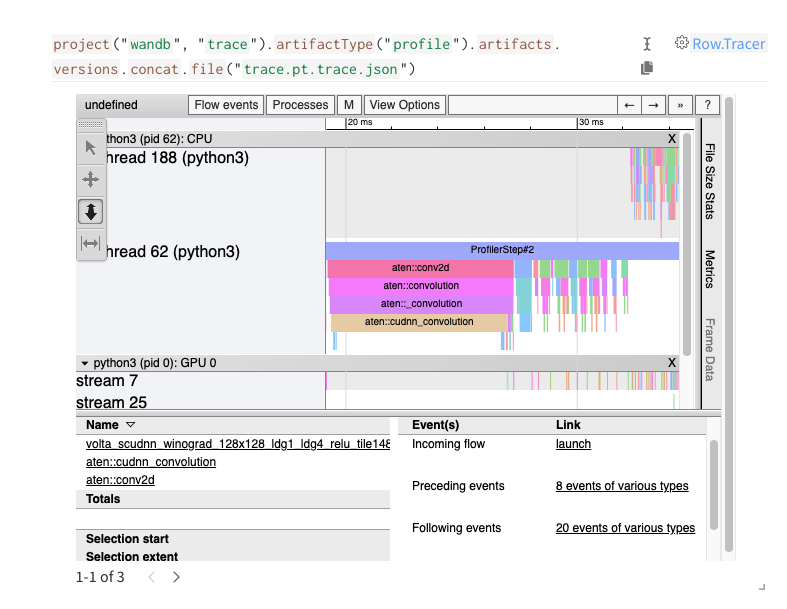
W&B integrates directly with PyTorch Kineto's Tensorboard plugin to provide tools for profiling PyTorch code, inspecting the details of CPU and GPU communication, and identifying bottlenecks and optimizations.
profile_dir = "path/to/run/tbprofile/"
profiler = torch.profiler.profile(
    schedule=schedule,  # see the profiler docs for details on scheduling
    on_trace_ready=torch.profiler.tensorboard_trace_handler(profile_dir),
    with_stack=True,
)

with profiler:
    ...  # run the code you want to profile here
    # see the profiler docs for detailed usage information

# create a wandb Artifact
profile_art = wandb.Artifact("trace", type="profile")
# add the pt.trace.json files to the Artifact
profile_art.add_file(glob.glob(profile_dir + ".pt.trace.json"))
# log the artifact
profile_art.save()
See and run working example code in this Colab.
The interactive trace viewing tool is based on the Chrome Trace Viewer, which works best with the Chrome browser.