Run Page
Use the run page to explore detailed information about a specific run within a project.
Overview tab
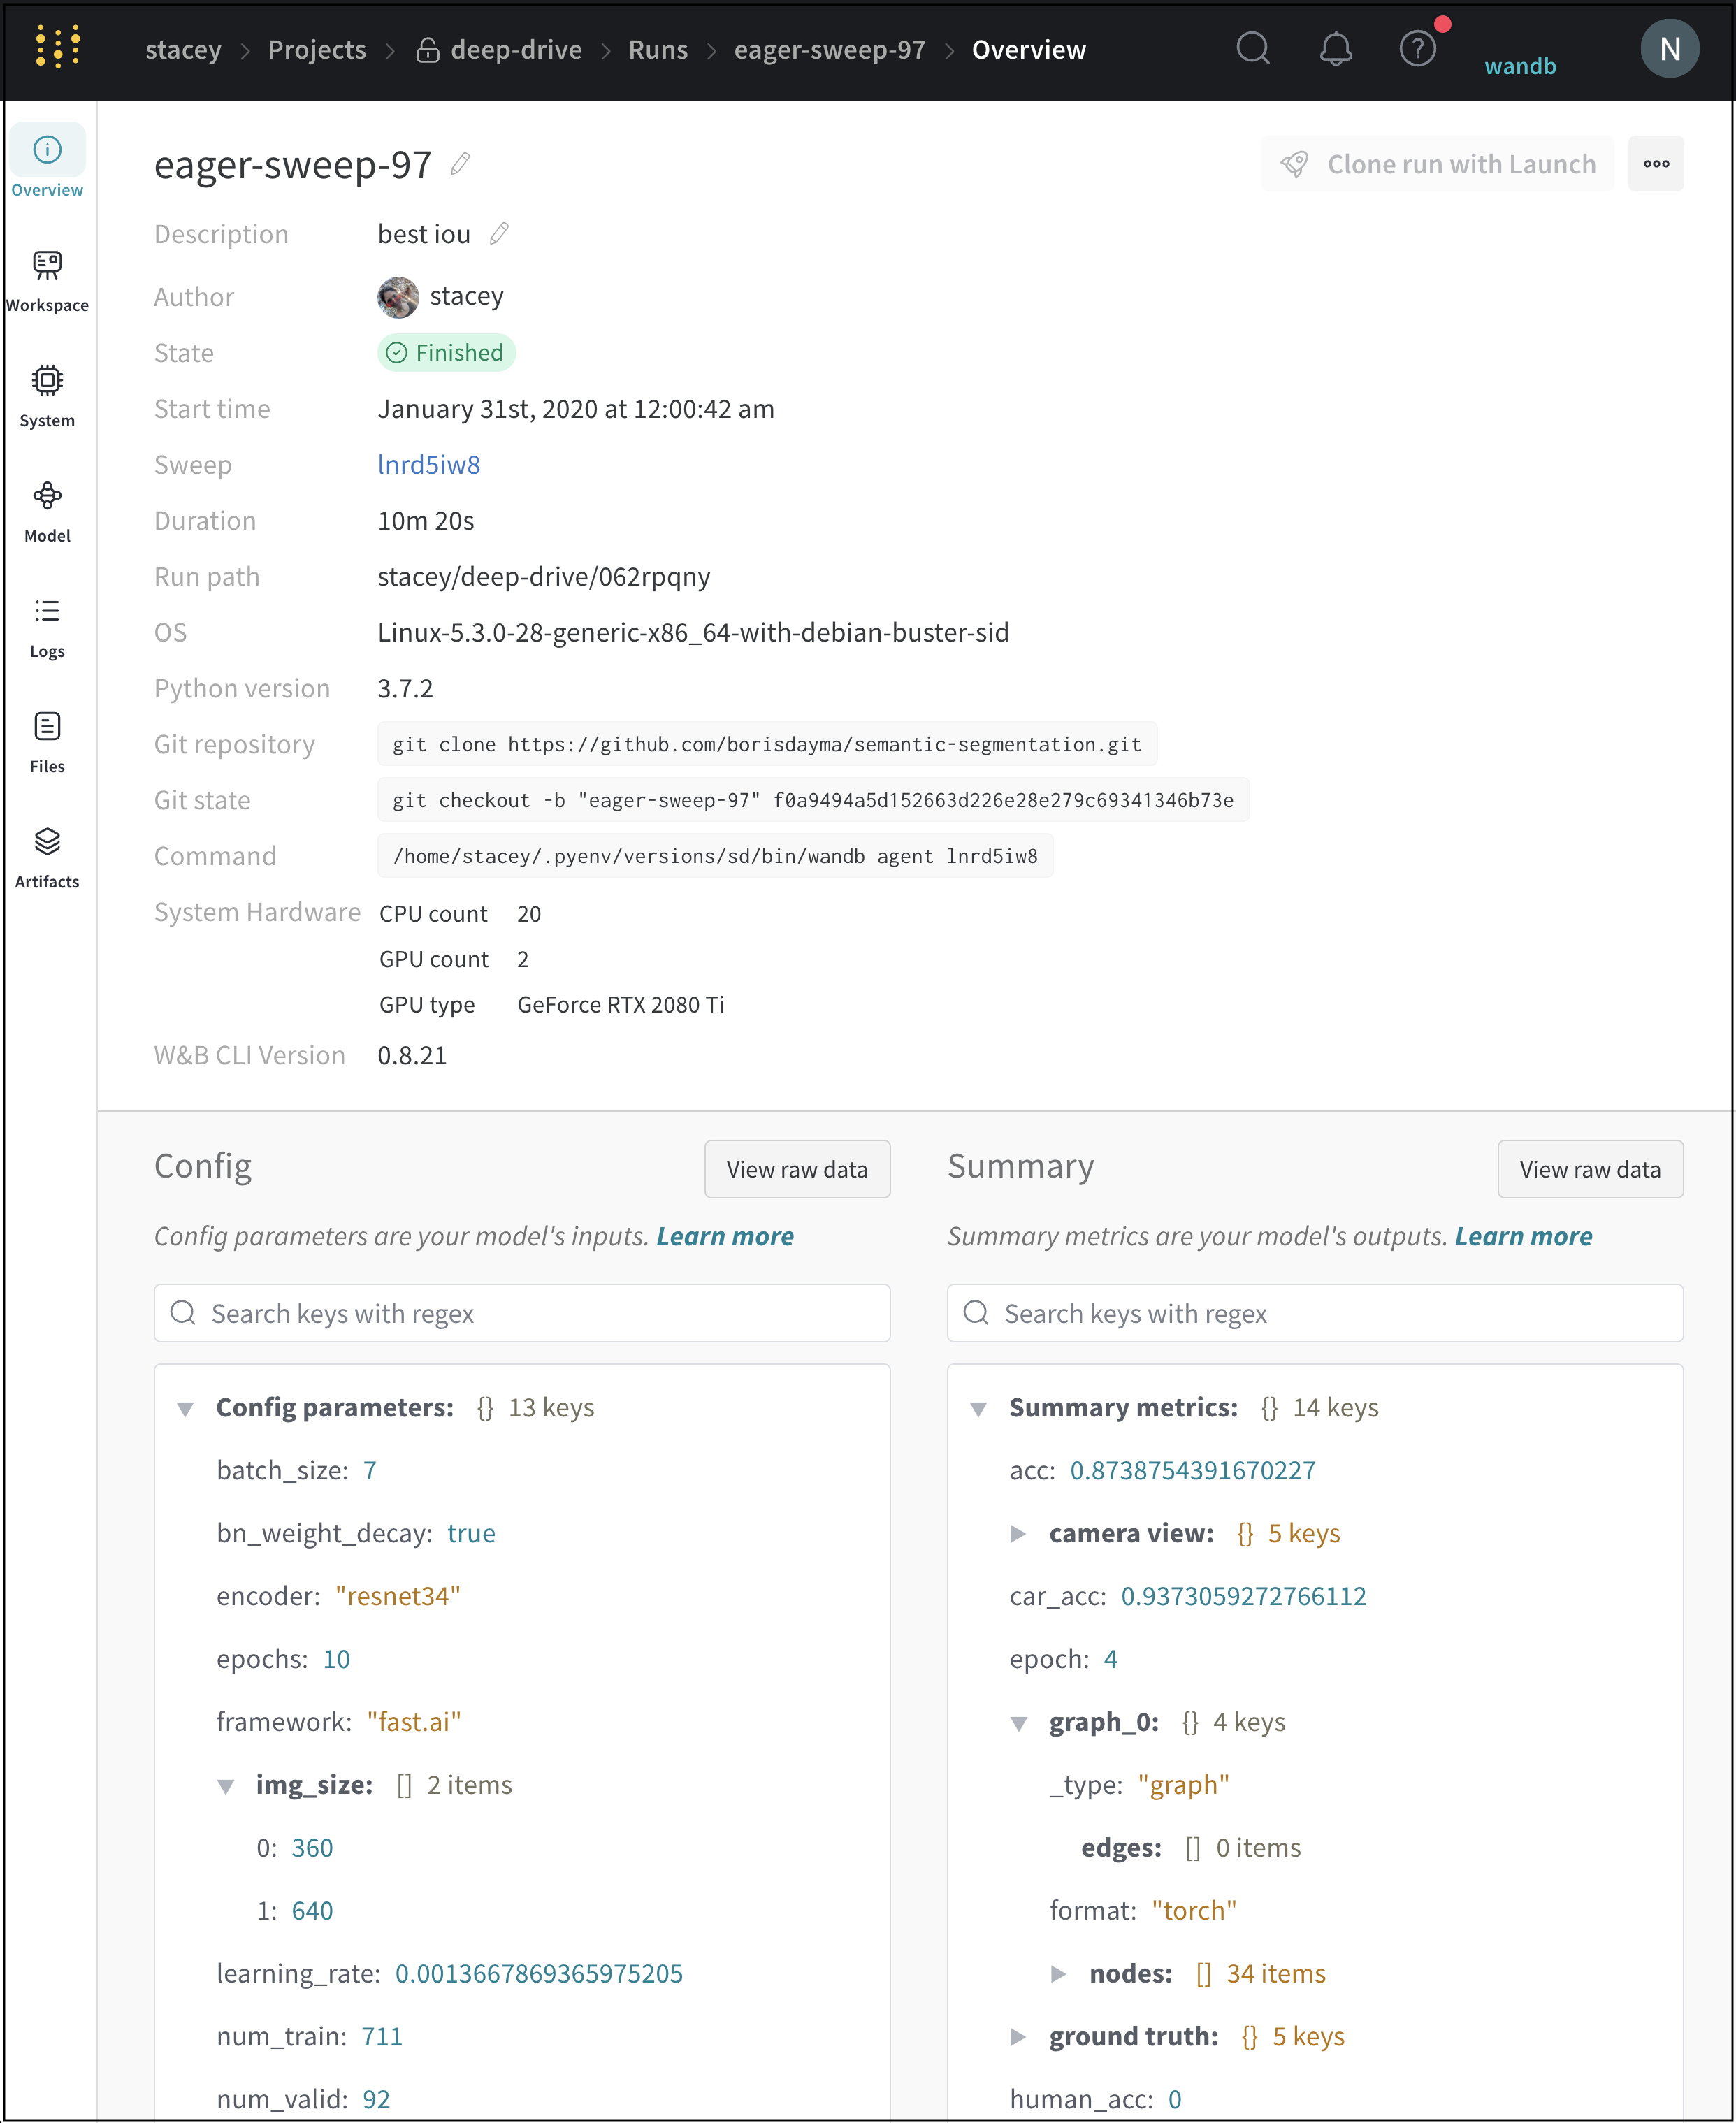
Use the Overview tab learn about a specific run in a project, such as:
- Name: The name of the run
- Description: A description of the run
- Author: The W&B entity that created the run
- State: The state of the run
- Start time: The timestamp when the run is initialized
- Duration: How long it took for the run to reach a state
- Run path: A unique run path
<entity>/<project>/<run_id> - OS: Operating system that initialized the run
- Python version: The Python version that created the run
- Git repository: If git is enabled, the git repository associated with the run
- Command: The command that initialized the run
- System hardware: The hardware the run was executed on
- Config: List of config parameters saved with
wandb.config - Summary: List of summary parameters saved with
wandb.log(), by default set to the last value logged
To view the a run's overview page:
- Within your project workspace, click on a specific run.
- Next, click on the Overview tab on the left hand column.
Run states
The proceeding table describes the possible states a run can be in:
| State | Description |
|---|---|
| Finished | Run ended and fully synced data, or called wandb.finish() |
| Failed | Run ended with a non-zero exit status |
| Crashed | Run stopped sending heartbeats in the internal process, which can happen if the machine crashes |
| Running | Run is still running and has recently sent a heartbeat |
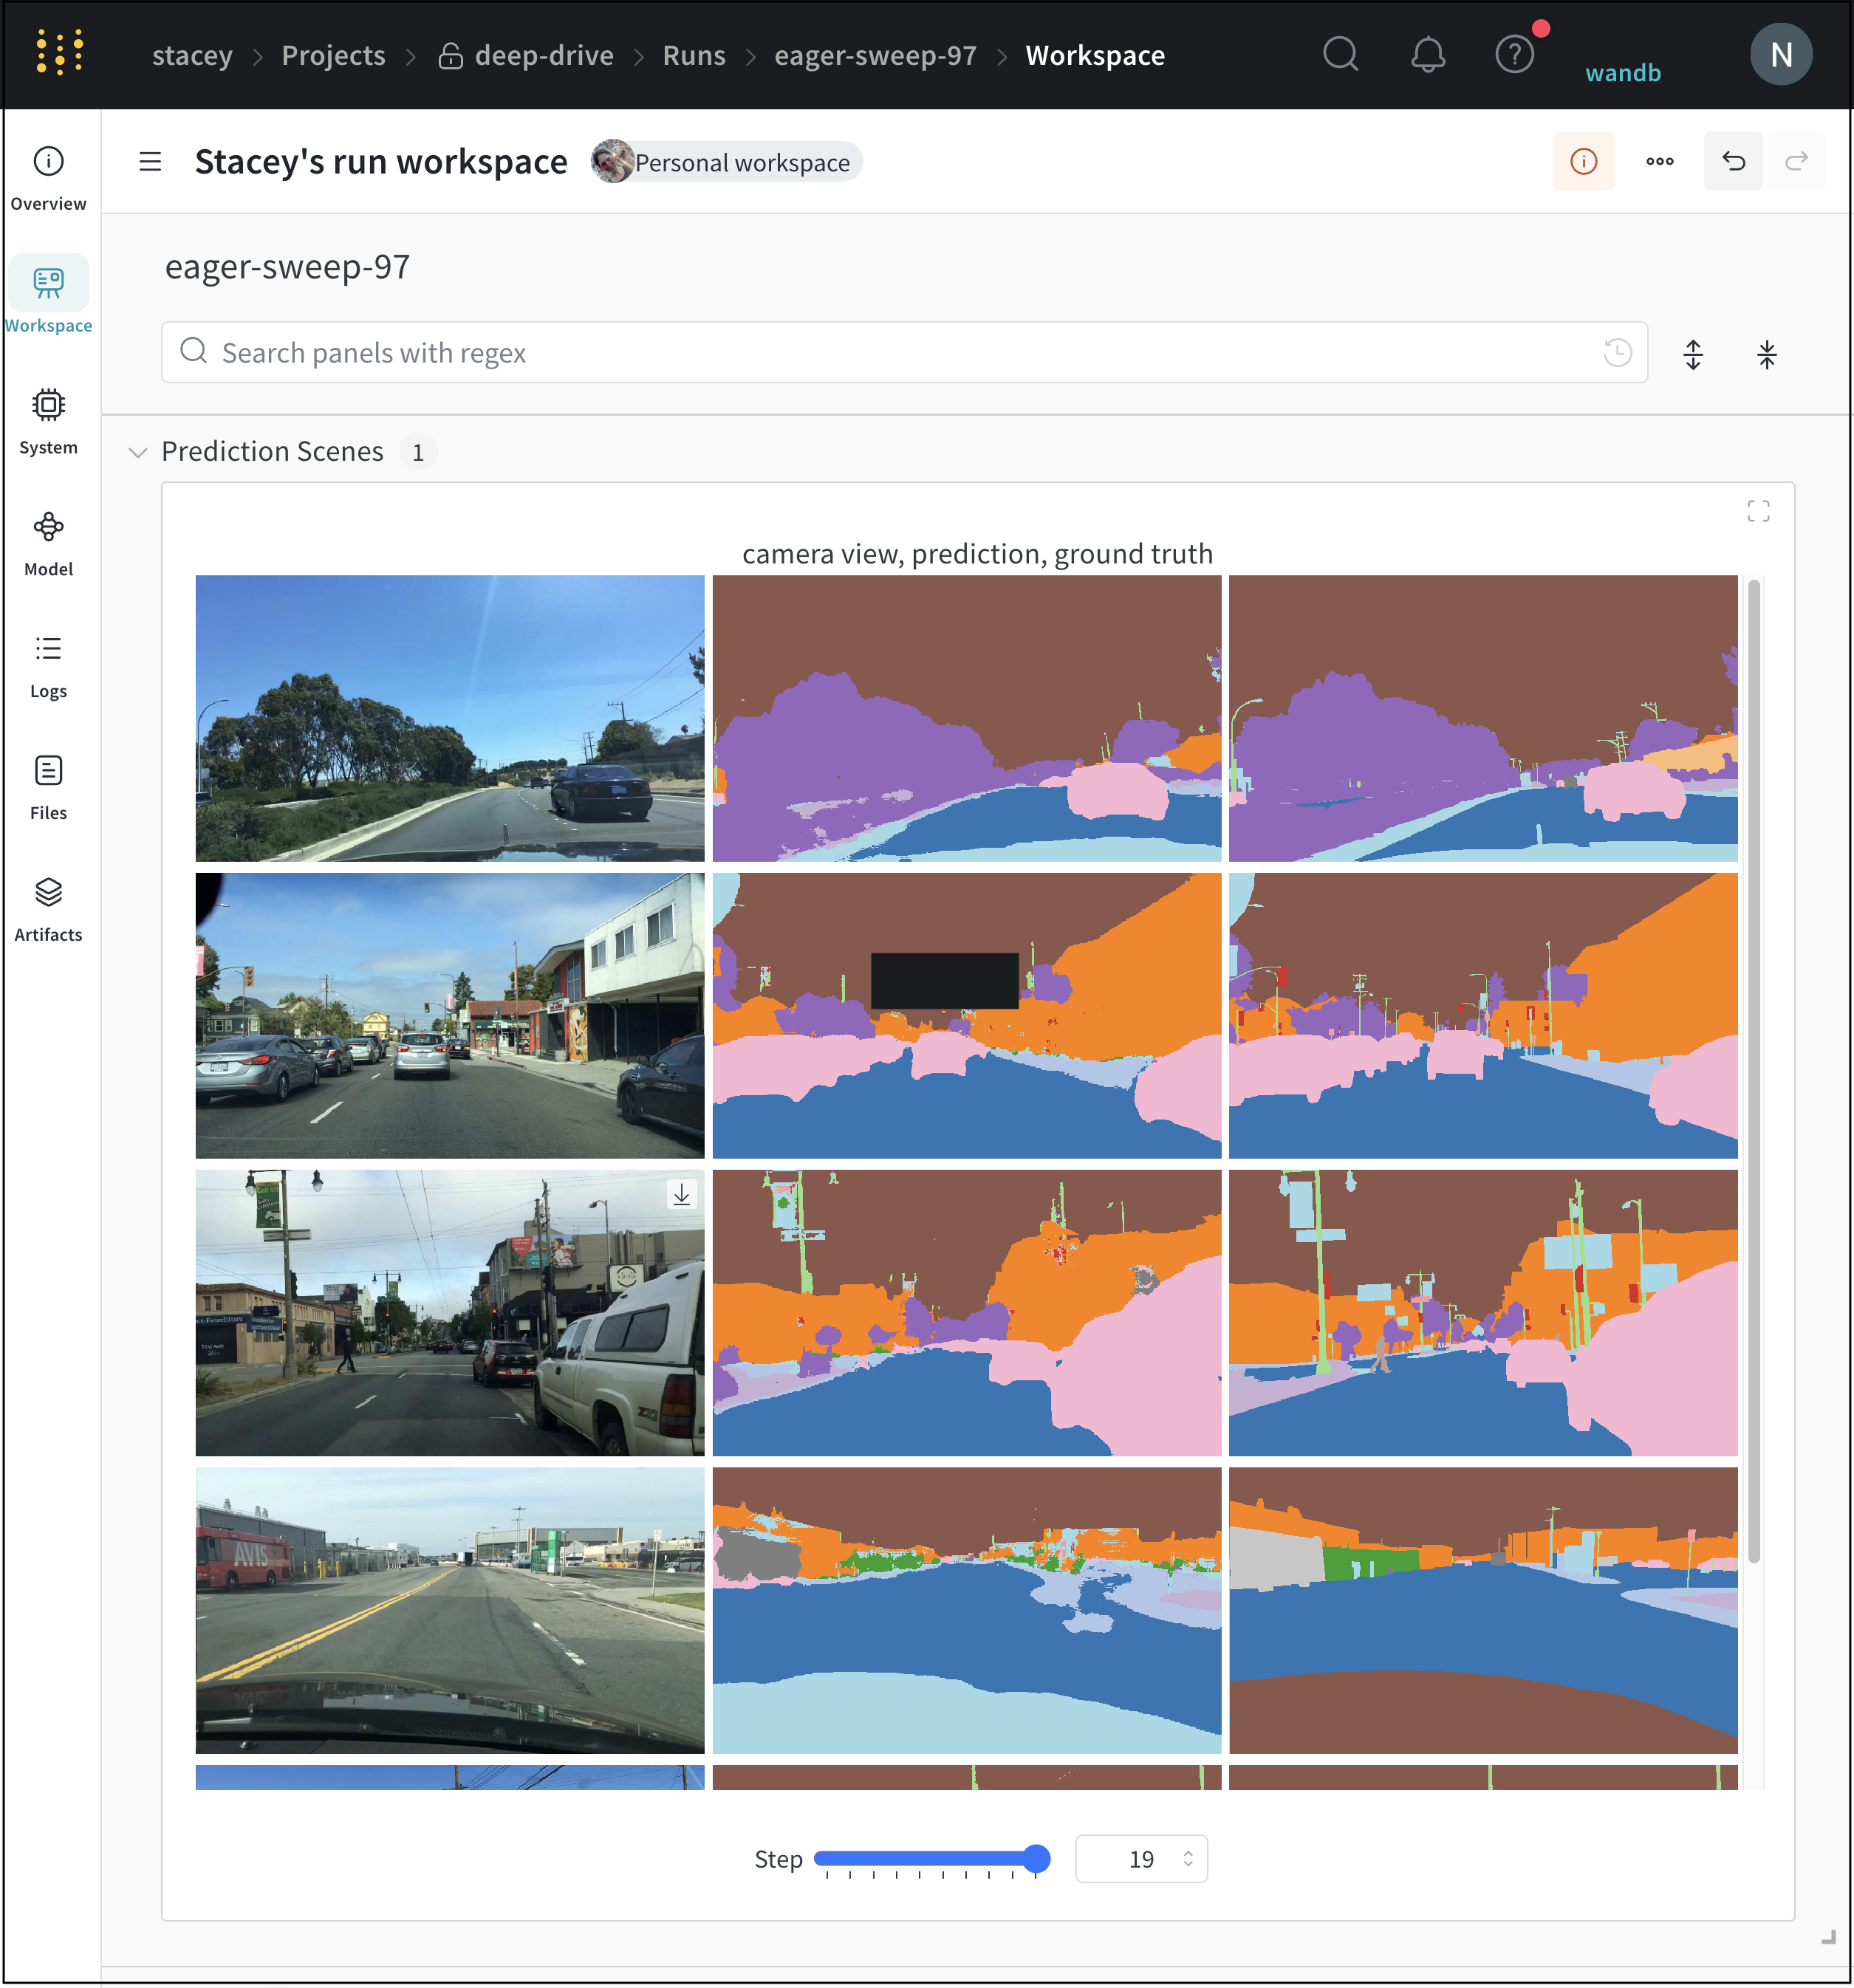
Workspace tab
Use the Workspace tab to view, search, group and arrange visualizations such as:
- Autogenerated plots such as examples predictions made by a validation set
- Custom plots
- System metrics and more
Create charts manually with the W&B App UI or programmatically with the W&B Python SDK. See Log media and objects in Experiments for more information.
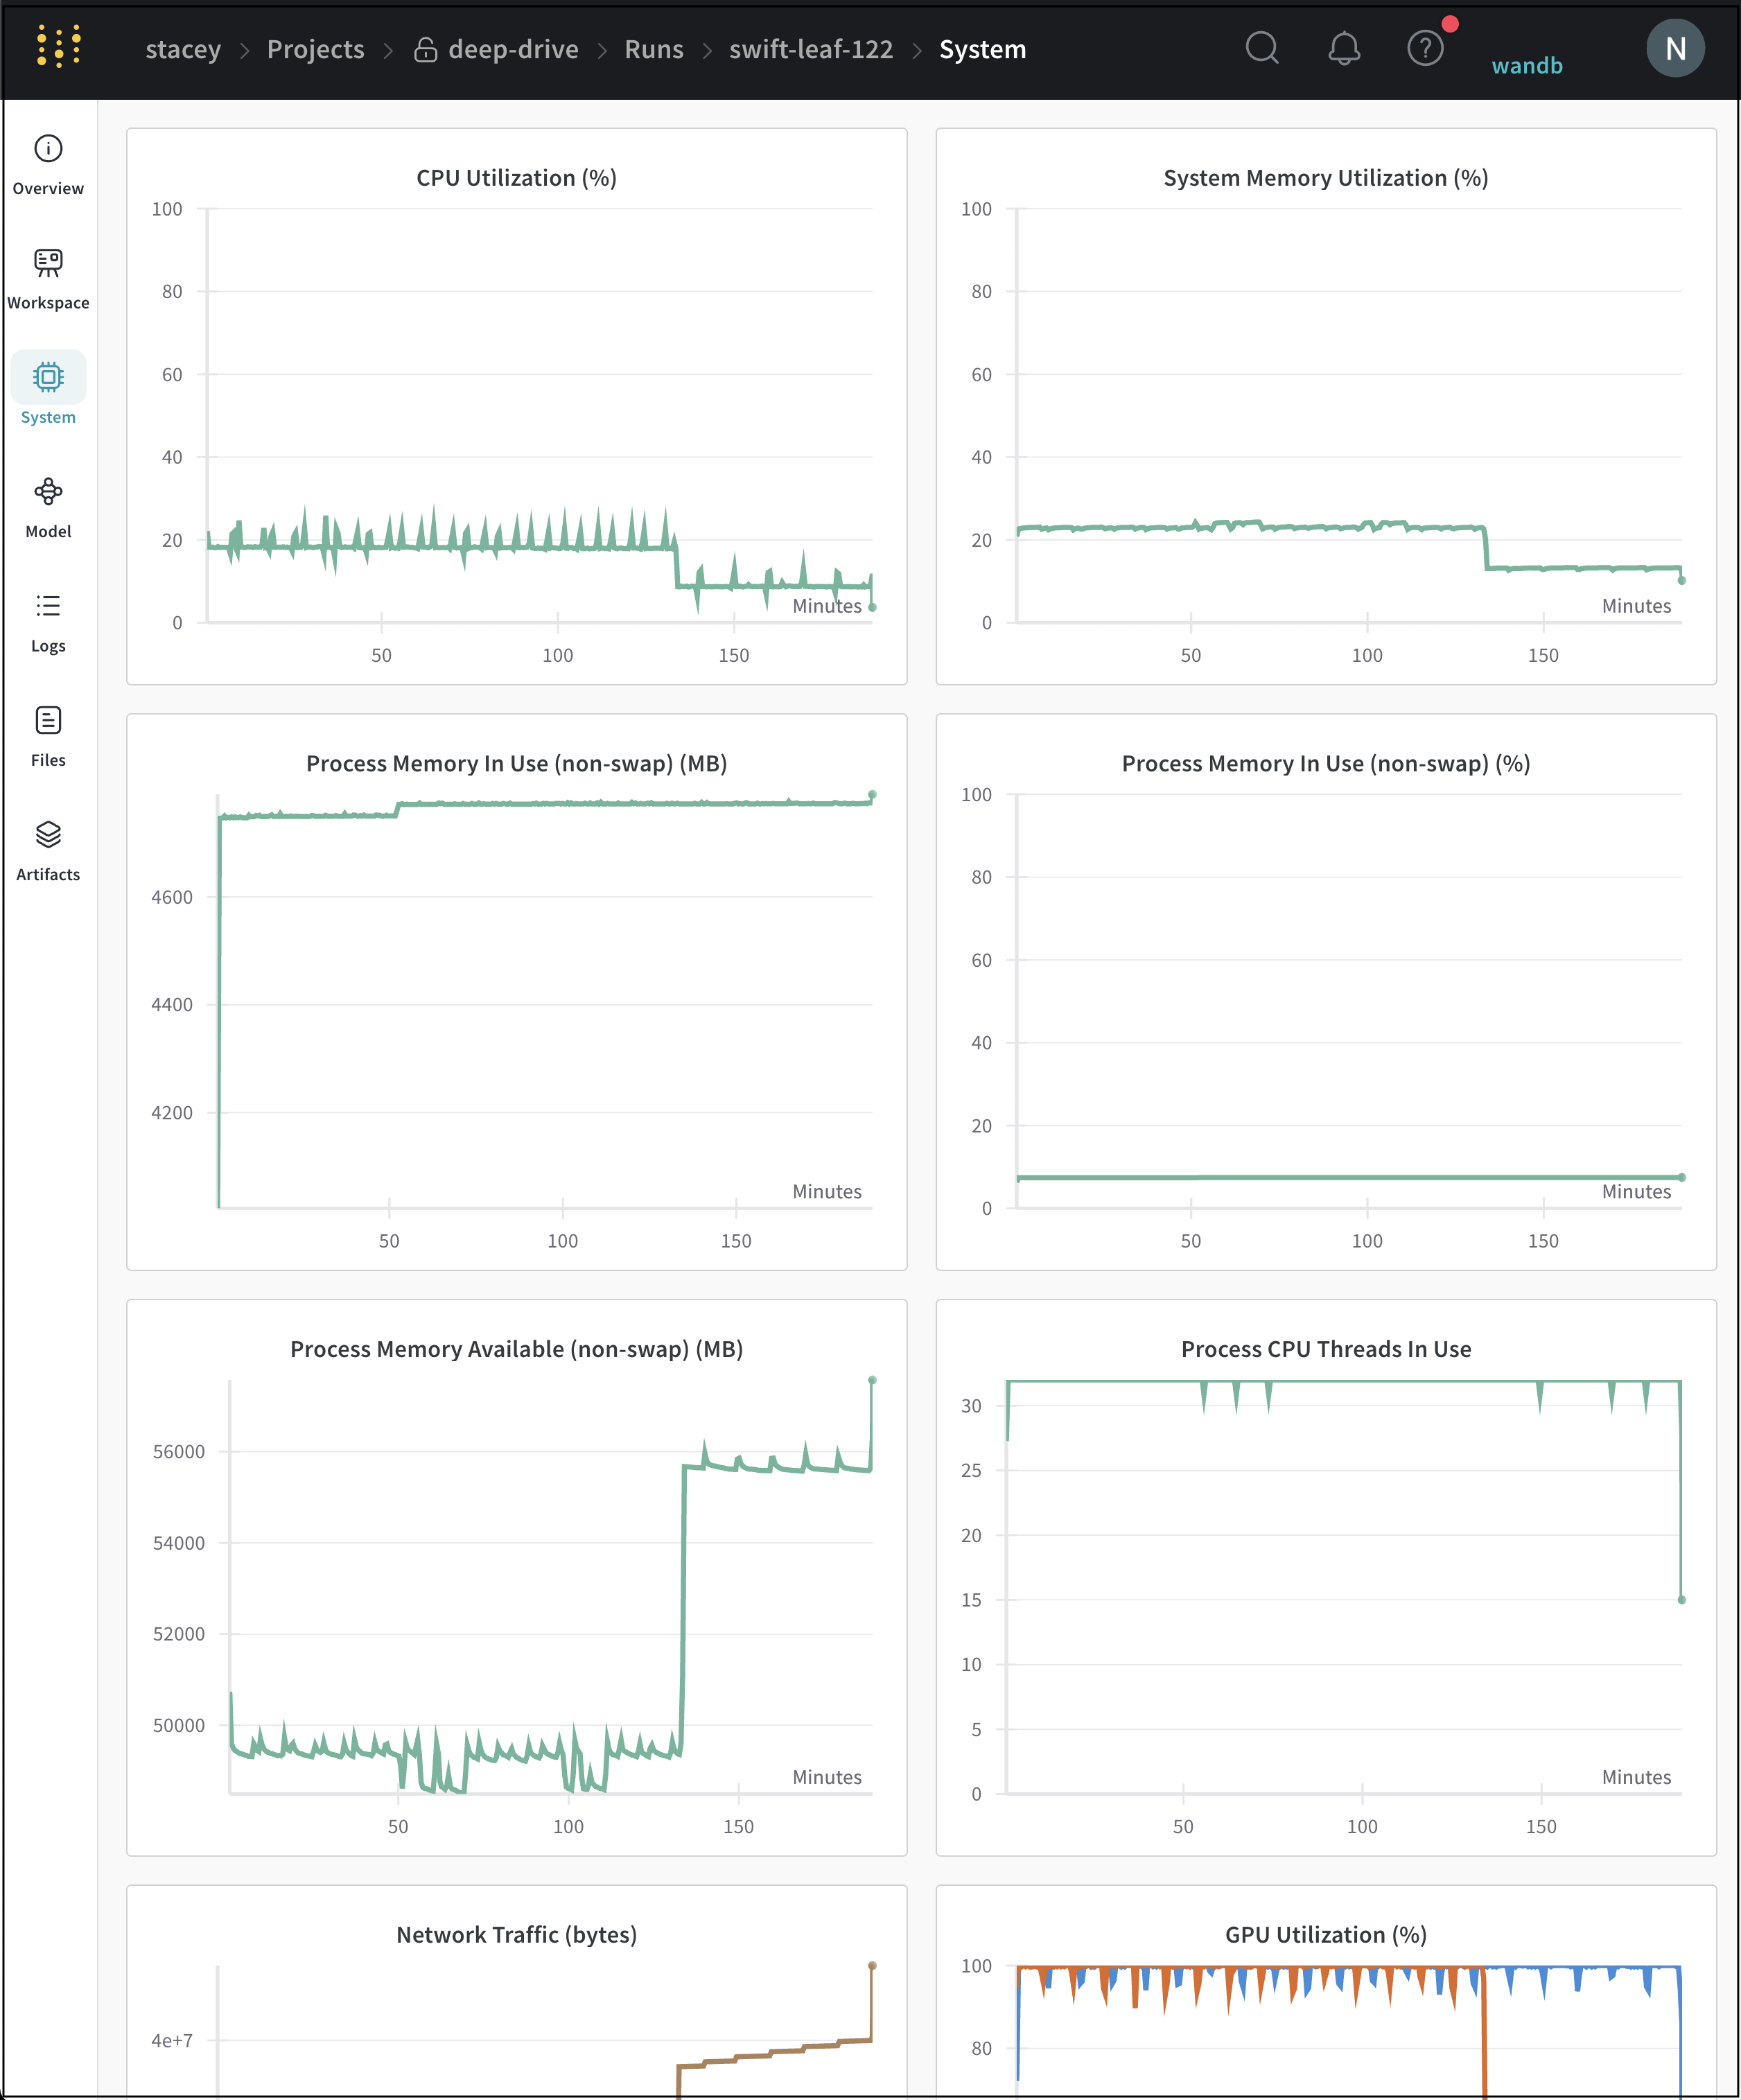
System tab
The System tab shows system metrics tracked for a specific run such as:
- Visualize CPU utilization
- System memory
- Disk I/O
- Network traffic
- GPU utilization
- GPU temperature
- GPU time spent accessing memory
- GPU memory allocated
- GPU power usage
"See the Tracking System Resource" blog by Lambda Labs for more information on how to use W&B system metrics.
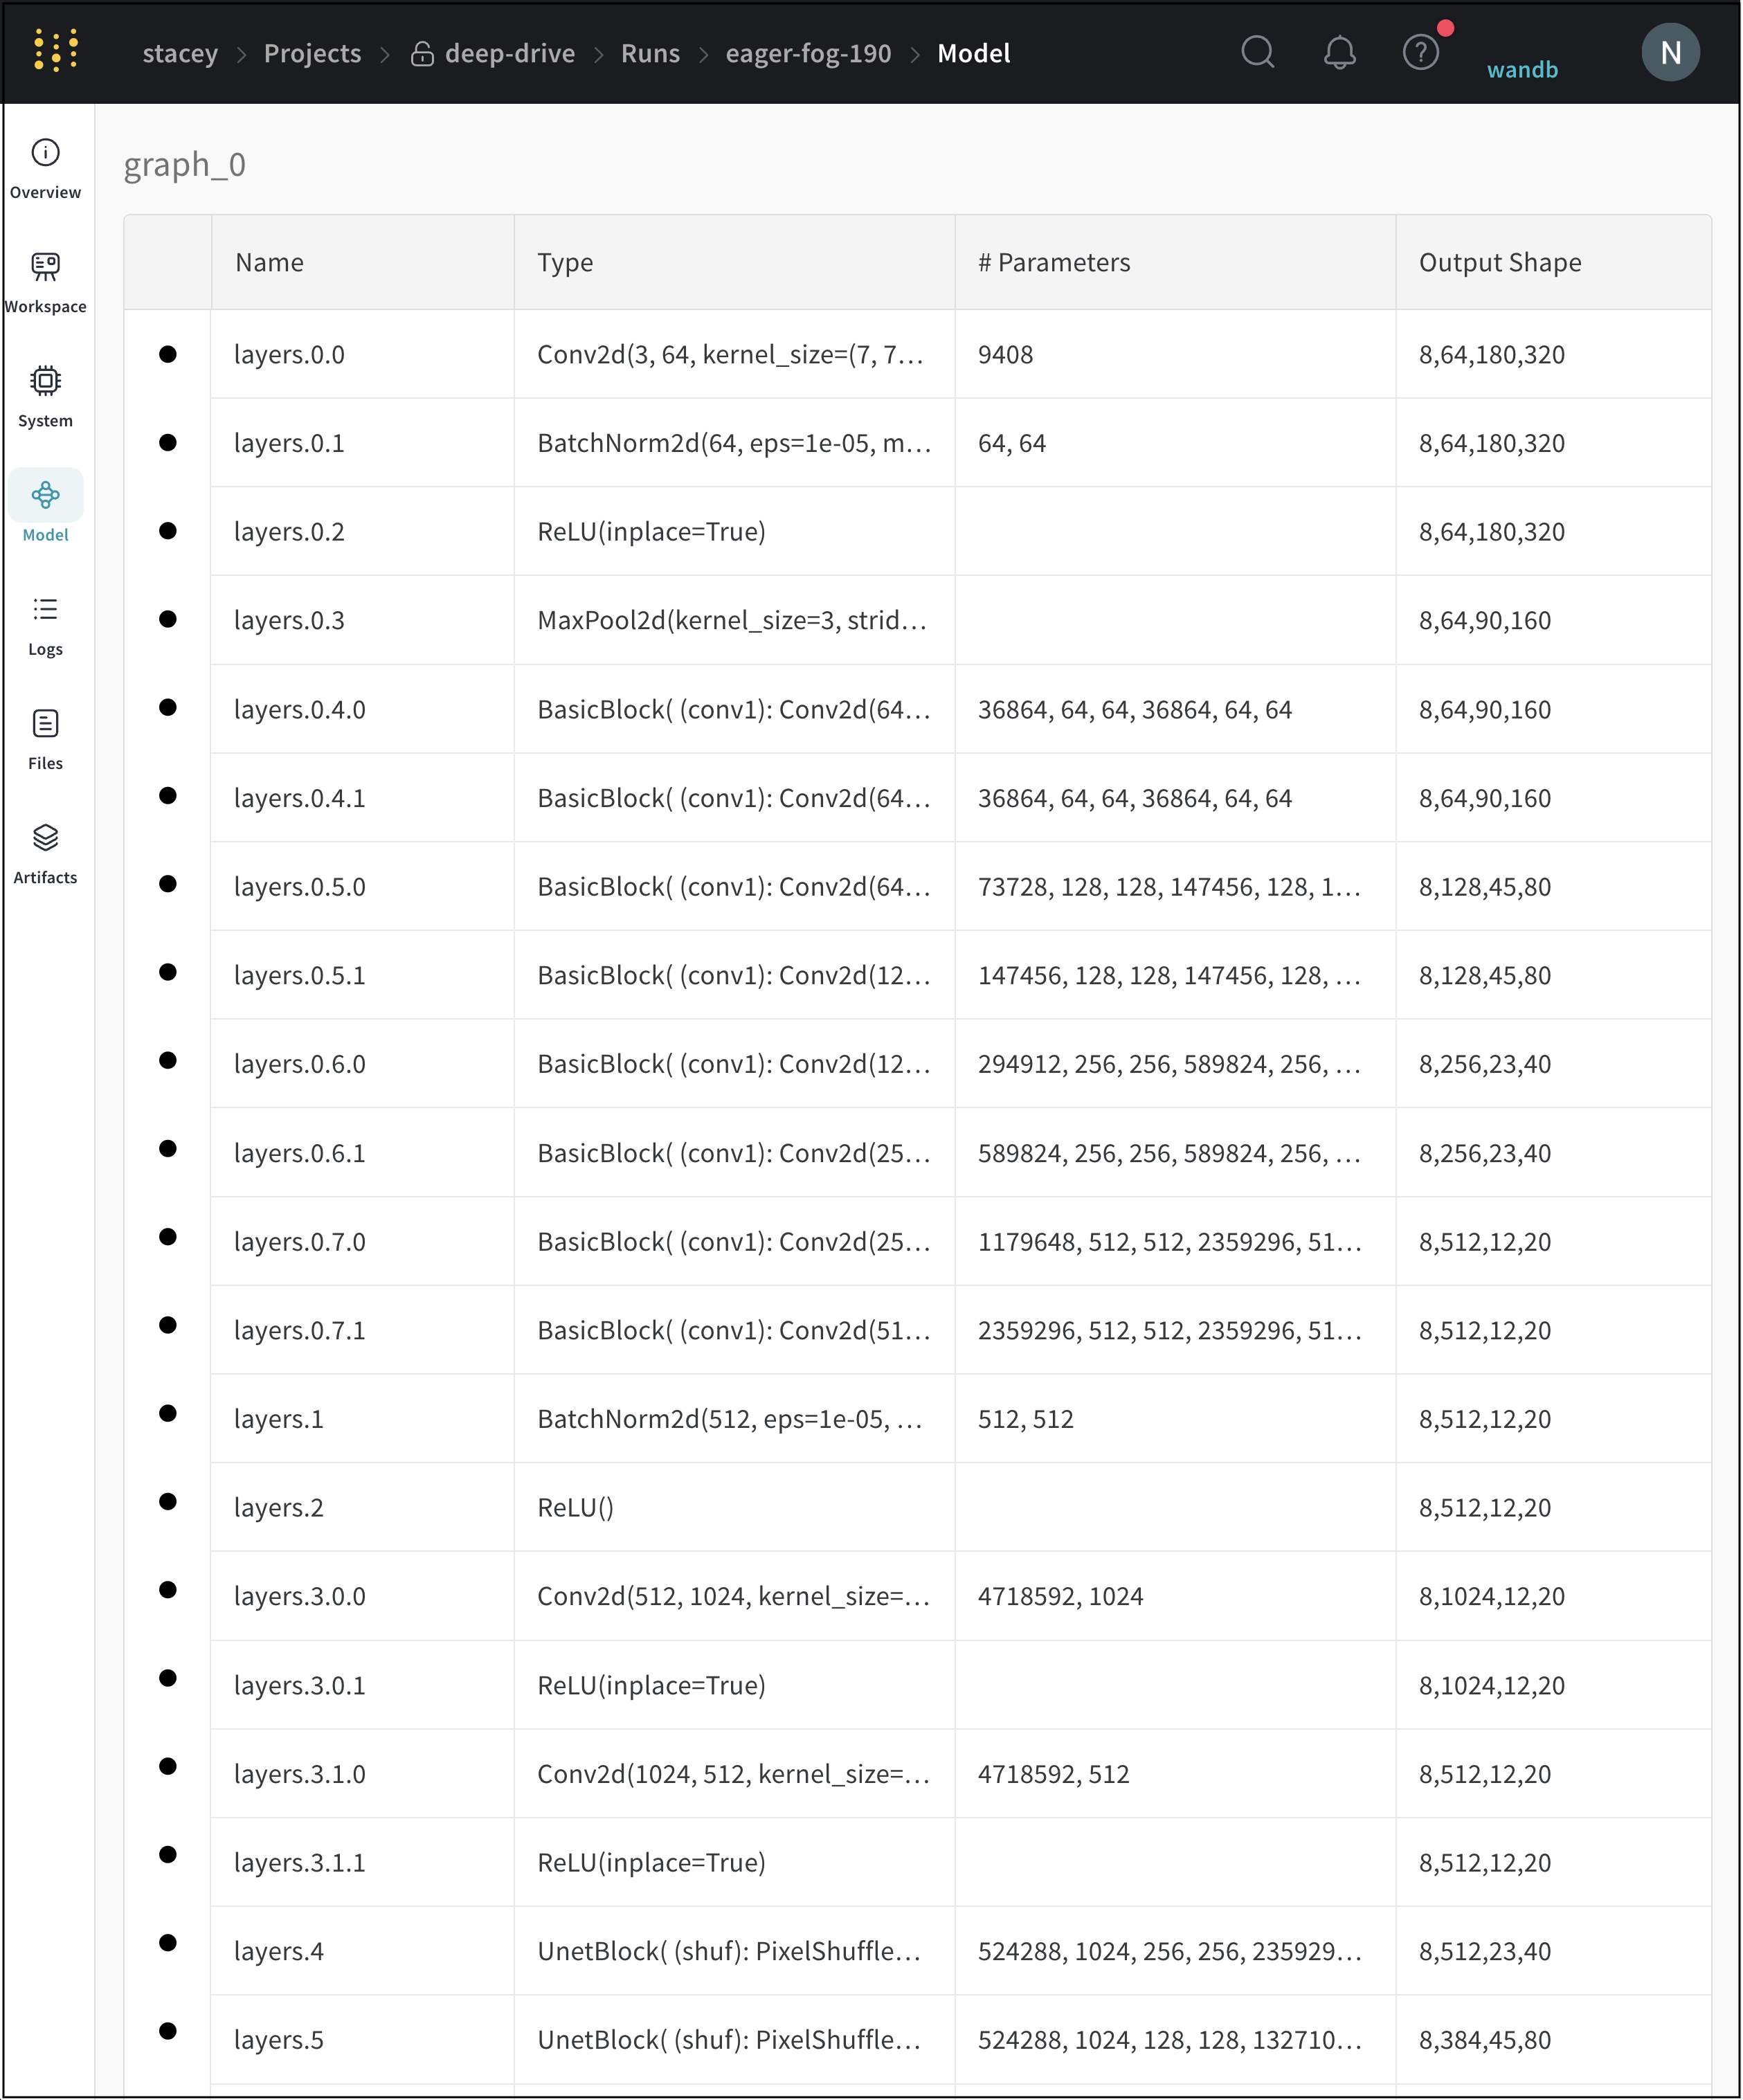
Model tab
See the layers of your model, the number of parameters, and the output shape of each layer within the Model Tab.
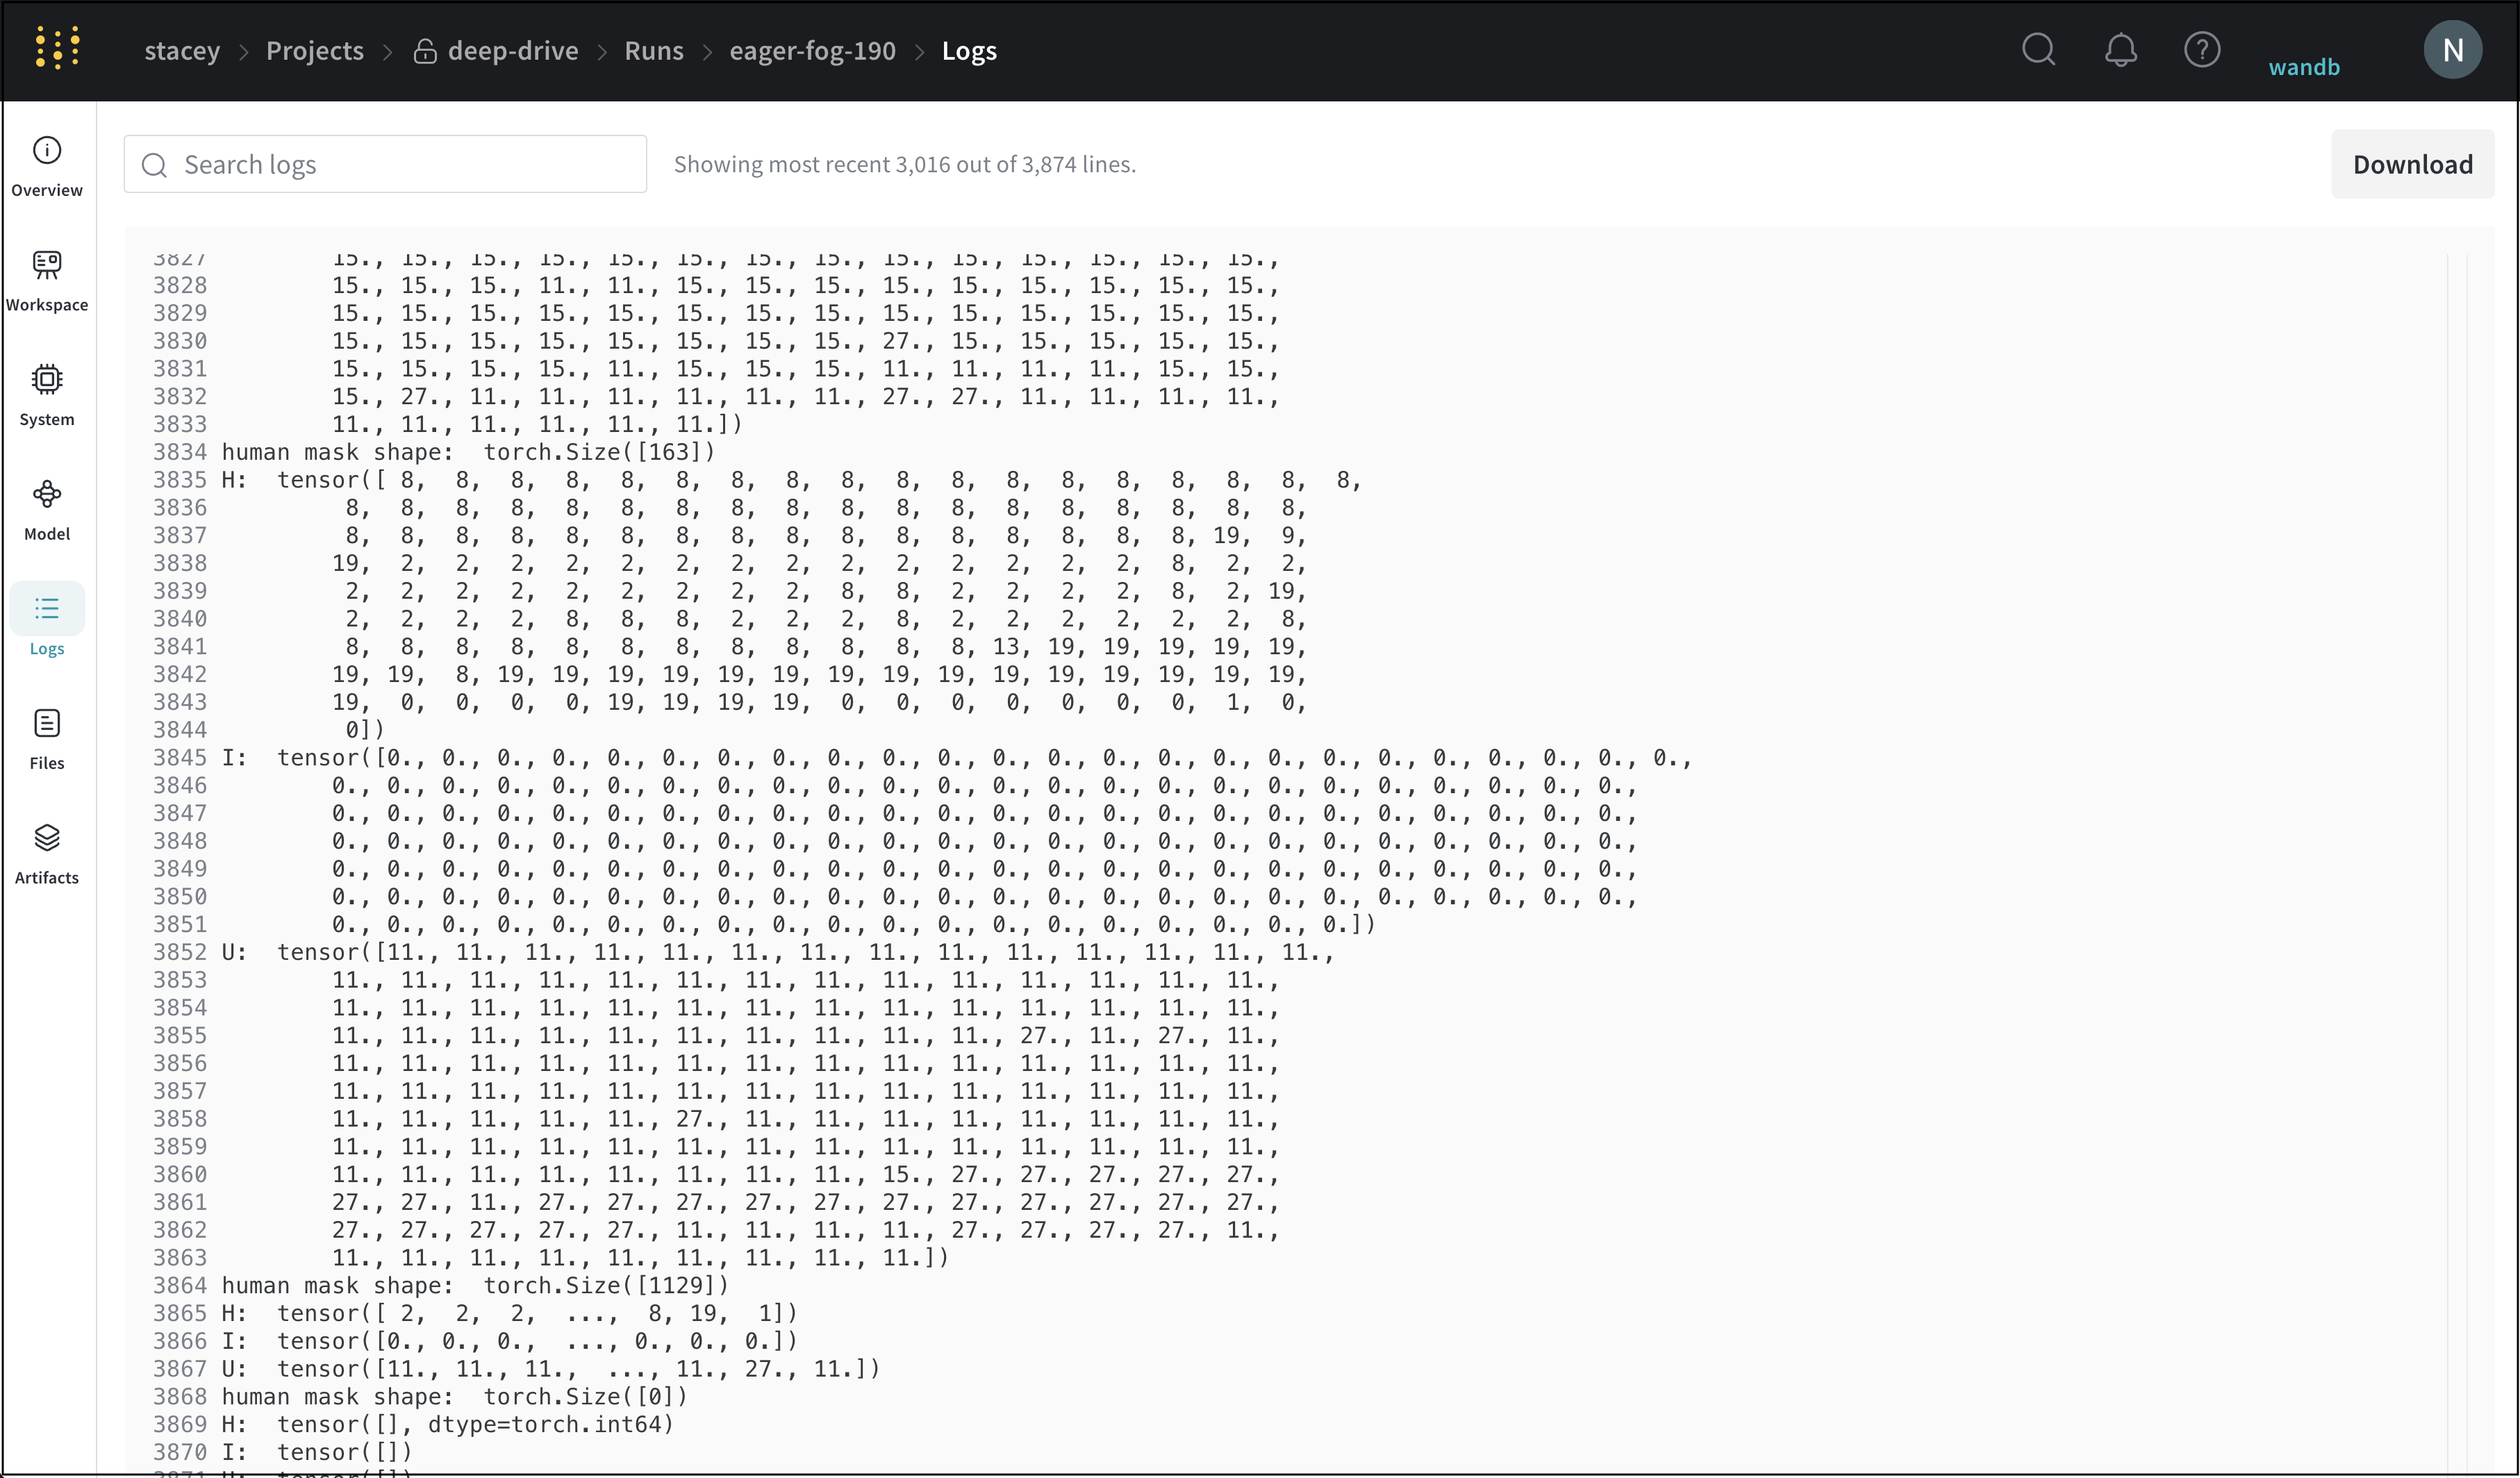
Logs tab
The Log tab shows output printed on the command line such as the stdout and stderr. W&B shows the last 10,000 lines.
Click the Download button in the upper right hand corner to download the log file.
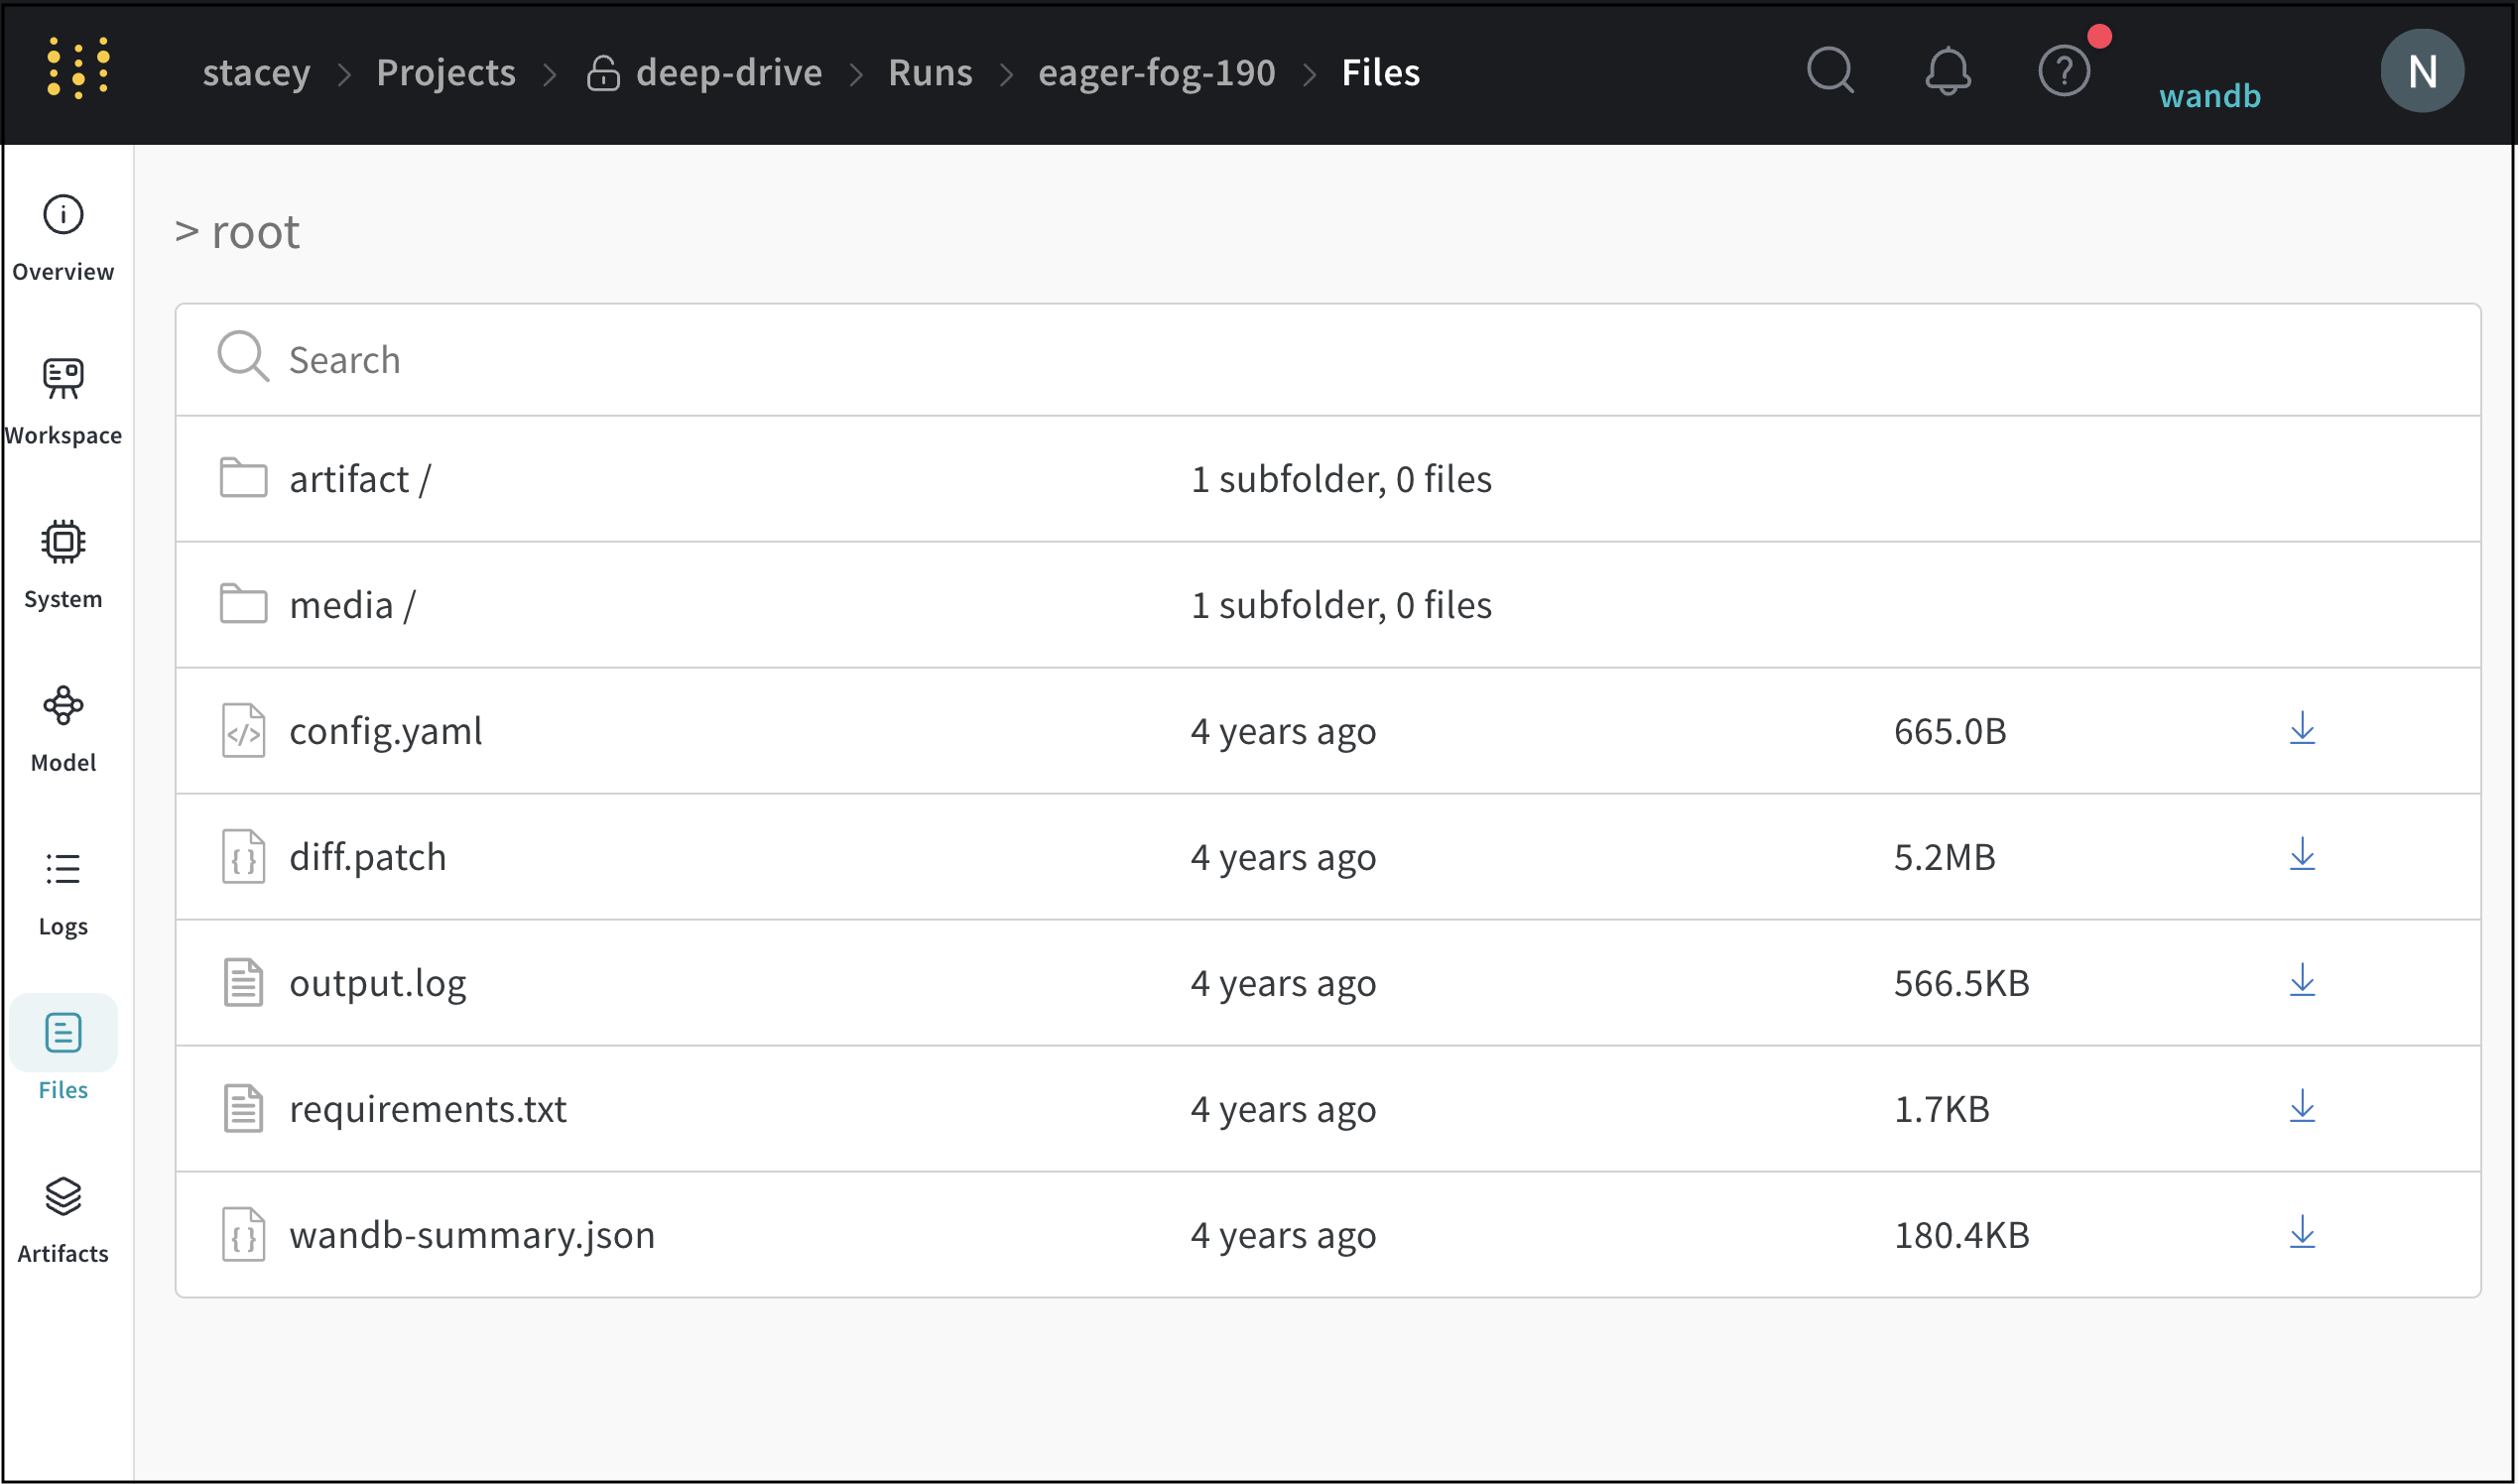
Files tab
Use the Files tab to view files associated with a specific run. Keep model checkpoints, validation set examples, and more
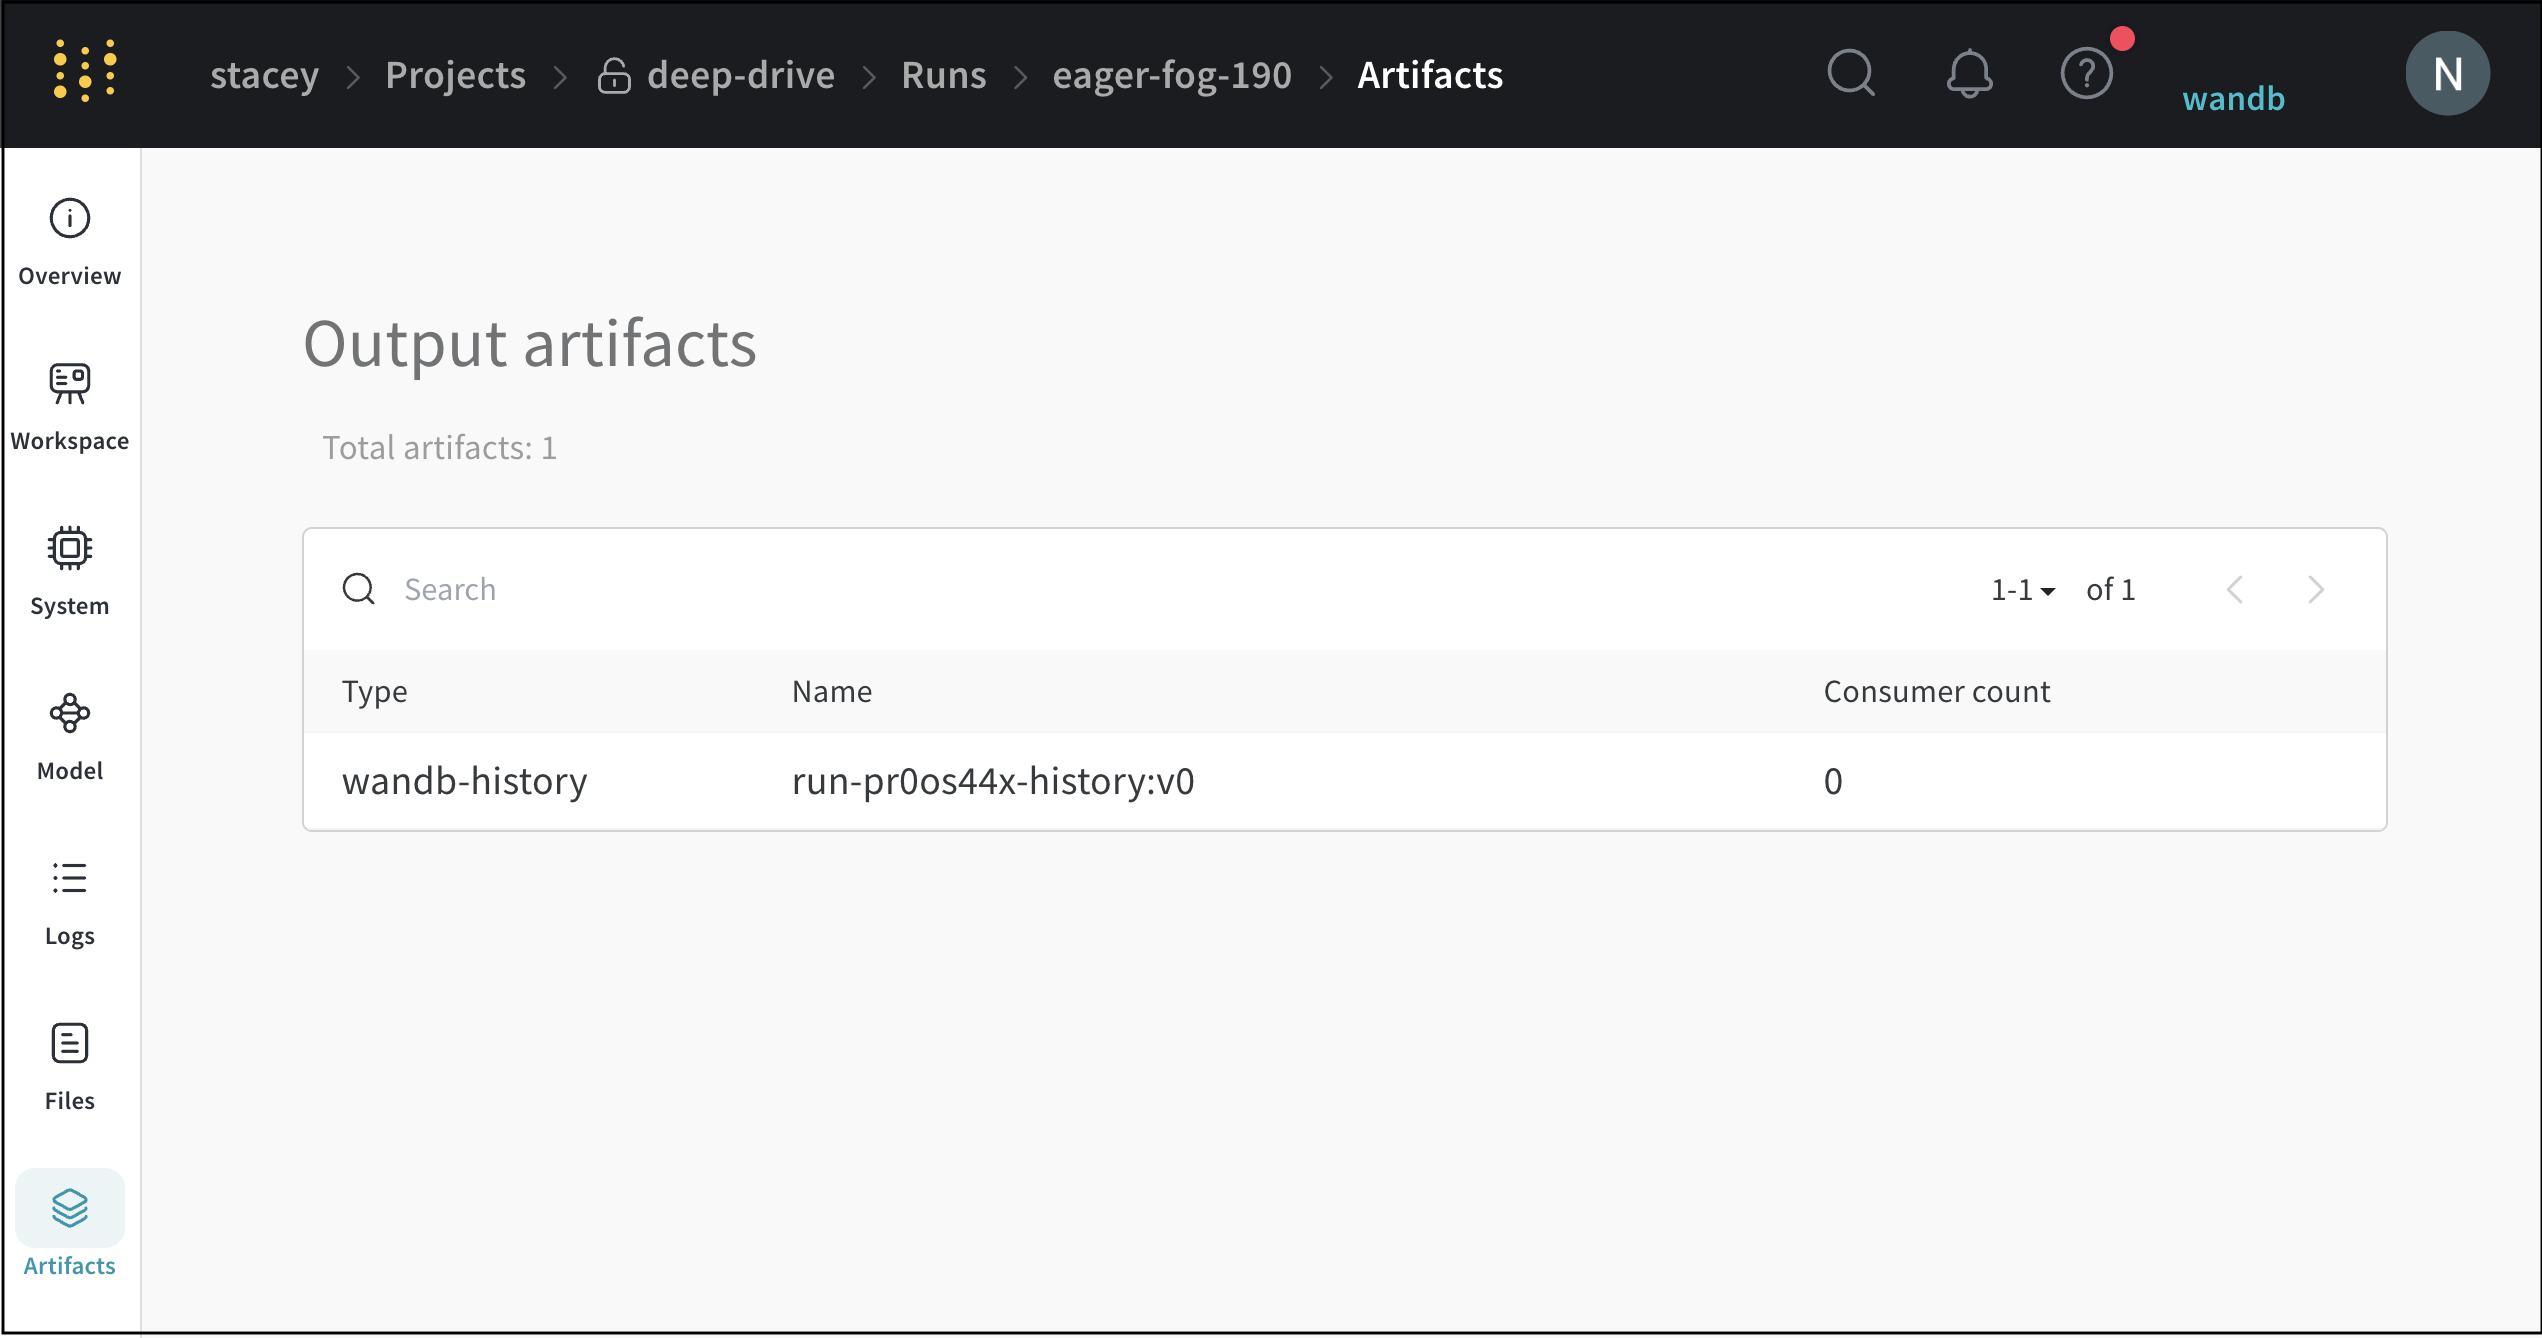
Artifacts tab
The Artifacts tab lists the input and output Artifacts for the specified run.