Limits and performance
Keep your pages in W&B faster and more responsive by logging within the following suggested bounds.
Logged metrics
Use wandb.log to track experiment metrics. Once logged, these metrics generate charts and show up in tables. Too much logged data can make the app slow.
Distinct metric count
For faster performance, keep the total number of distinct metrics in a project under 10,000.
import wandb

wandb.log(
    {
        "a": 1,  # "a" is a distinct metric
        "b": {
            "c": "hello",  # "b.c" is a distinct metric
            "d": [1, 2, 3],  # "b.d" is a distinct metric
        },
    }
)
W&B automatically flattens nested values. This means that if you pass a dictionary, W&B turns it into a dot-separated name. For config values, W&B supports 3 dots in the name. For summary values, W&B supports 4 dots.
If your workspace suddenly slows down, check whether recent runs have unintentionally logged thousands of new metrics. (This is easiest to spot by seeing sections with thousands of plots that have only one or two runs visible on them.) If they have, consider deleting those runs and recreating them with the desired metrics.
Value width
Limit the size of a single logged value to under 1 MB and the total size of a single wandb.log call to under 25 MB. This limit does not apply to wandb.Media types like wandb.Image, wandb.Audio, etc.
# ❌ not recommended
wandb.log({"wide_key": range(10000000)})

# ❌ not recommended
with f as open("large_file.json", "r"):
    large_data = json.load(f)
    wandb.log(large_data)
Wide values can affect the plot load times for all metrics in the run, not just the metric with the wide values.
Data is saved and tracked even if you log values wider than the recommended amount. However, your plots may load more slowly.
Metric frequency
Pick a logging frequency that is appropriate to the metric you are logging. As a general rule of thumb, the wider the metric the less frequently you should log it. W&B recommends:
- Scalars: <100,000 logged points per metric
- Media: <50,000 logged points per metric
- Histograms: <10,000 logged points per metric
# Training loop with 1m total steps
for step in range(1000000):
    # ❌ not recommended
    wandb.log(
        {
            "scalar": step,  # 100,000 scalars
            "media": wandb.Image(...),  # 100,000 images
            "histogram": wandb.Histogram(...),  # 100,000 histograms
        }
    )

    # ✅ recommended
    if step % 1000 == 0:
        wandb.log(
            {
                "histogram": wandb.Histogram(...),  # 10,000 histograms
            },
            commit=False,
        )
    if step % 200 == 0:
        wandb.log(
            {
                "media": wandb.Image(...),  # 50,000 images
            },
            commit=False,
        )
    if step % 100 == 0:
        wandb.log(
            {
                "scalar": step,  # 100,000 scalars
            },
            commit=True,
        )  # Commit batched, per-step metrics together
W&B continues to accept your logged data but pages may load more slowly if you exceed guidelines.
Config size
Limit the total size of your run config to less than 10 MB. Logging large values could slow down your project workspaces and runs table operations.
# ✅ recommended
wandb.init(
    config={
        "lr": 0.1,
        "batch_size": 32,
        "epochs": 4,
    }
)

# ❌ not recommended
wandb.init(
    config={
        "steps": range(10000000),
    }
)

# ❌ not recommended
with f as open("large_config.json", "r"):
    large_config = json.load(f)
    wandb.init(config=large_config)
Run count
For faster loading times, keep the total number of runs in a single project under 10,000. Large run counts can slow down project workspaces and runs table operations, especially when grouping is enabled or runs have a large count of distinct metrics.
If you find that you or your team are frequently accessing the same set of runs (for example, recent runs), consider bulk moving other runs to a new project used as an archive, leaving a smaller set of runs in your working project.
Section count
Having hundreds of sections in a workspace can hurt performance. Consider creating sections based on high-level groupings of metrics and avoiding an anti-pattern of one section for each metric.
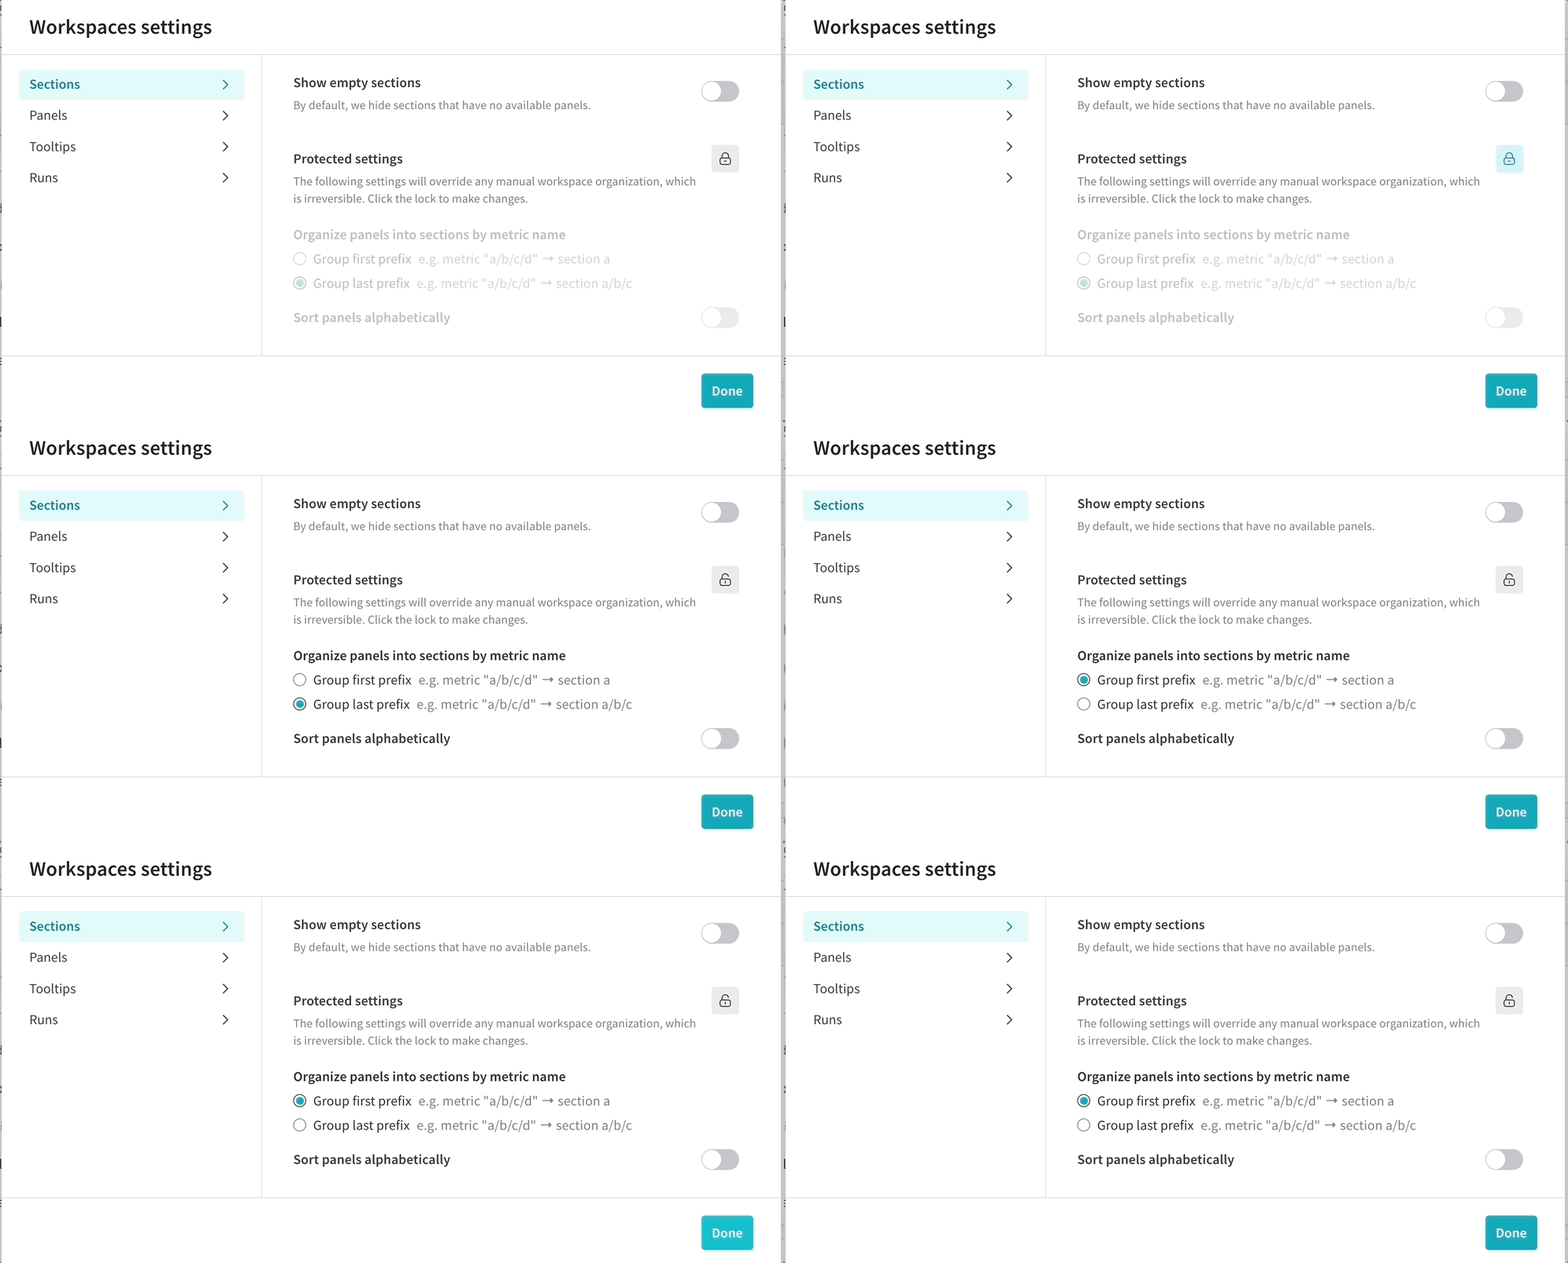
If you find you have too many sections and performance is slow, consider the workspace setting to create sections by prefix rather than suffix, which can result in fewer sections and better performance.

File count
Keep the total number of files uploaded for a single run under 1,000. You can use W&B Artifacts when you need to log a large number of files. Exceeding 1,000 files in a single run can slow down your run pages.
Python script performance
There are a few ways that your performance of your python script is reduced:
- The size of your data is too large. Large data sizes could introduce a >1 ms overhead to the training loop.
- The speed of your network and the how the W&B backend is configured
- Calling
wandb.logmore than a few times per second. This is due to a small latency added to the training loop every timewandb.logis called.
Is frequent logging slowing your training runs down? Check out this Colab for methods to get better performance by changing your logging strategy.
W&B does not assert any limits beyond rate limiting. The W&B Python SDK automatically completes an exponential "backoff" and "retry" requests that exceed limits. W&B Python SDK responds with a “Network failure” on the command line. For unpaid accounts, W&B may reach out in extreme cases where usage exceeds reasonable thresholds.
Rate limits
W&B SaaS Cloud API implements a rate limit to maintain system integrity and ensure availability. This measure prevents any single user from monopolizing available resources in the shared infrastructure, ensuring that the service remains accessible to all users. You may encounter a lower rate limit for a variety of reasons.
Rate limits are subject to change.
The wandb.log calls in your script utilize a metrics logging API to log your training data to W&B. This API is engaged through either online or offline syncing. In either case, it imposes a rate limit quota limit in a rolling time window. This includes limits on total request size and request rate, where latter refers to the number of requests in a time duration.
Rate limits are applied to each W&B project. So if you have 3 projects in a team, each project has its own rate limit quota. Users on Teams and Enterprise plans have higher rate limits than those on the Free plan.
Rate limit HTTP headers
The proceeding table describes rate limit HTTP headers:
| Header name | Description |
|---|---|
| RateLimit-Limit | The amount of quota available per time window, scaled in the range of 0 to 1000 |
| RateLimit-Remaining | The amount of quota in the current rate limit window, scaled in the range of 0 and 1000 |
| RateLimit-Reset | The number of seconds until the current quota resets |
Suggestions on how to stay under the rate limit
Exceeding the rate limit may result in increased latency in the run.finish() operation. To avoid this, consider the following strategies:
- Update your W&B Python SDK version: Ensure you are using the latest version of the W&B Python SDK. The W&B Python SDK is regularly updated and includes enhanced mechanisms for gracefully retrying requests and optimizing quota usage.
- Reduce metric logging frequency: Minimize the frequency of logging metrics to conserve your quota. For example, you can modify your code to log metrics every five epochs instead of every epoch:
if epoch % 5 == 0:  # Log metrics every 5 epochs
    wandb.log({"acc": accuracy, "loss": loss})
- Manual data syncing: Your run data is stored locally if you are rate limited. You can manually sync your data with the command
wandb sync <run-file-path>. For more details, see thewandb syncreference.
Browser considerations
The W&B app can be memory-intensive and performs best in Chrome. Depending on your computer's memory, having W&B active in 3+ tabs at once can cause performance to degrade; if you encounter unexpectedly slow performance, consider closing other tabs or applications.
Reporting performance issues to W&B
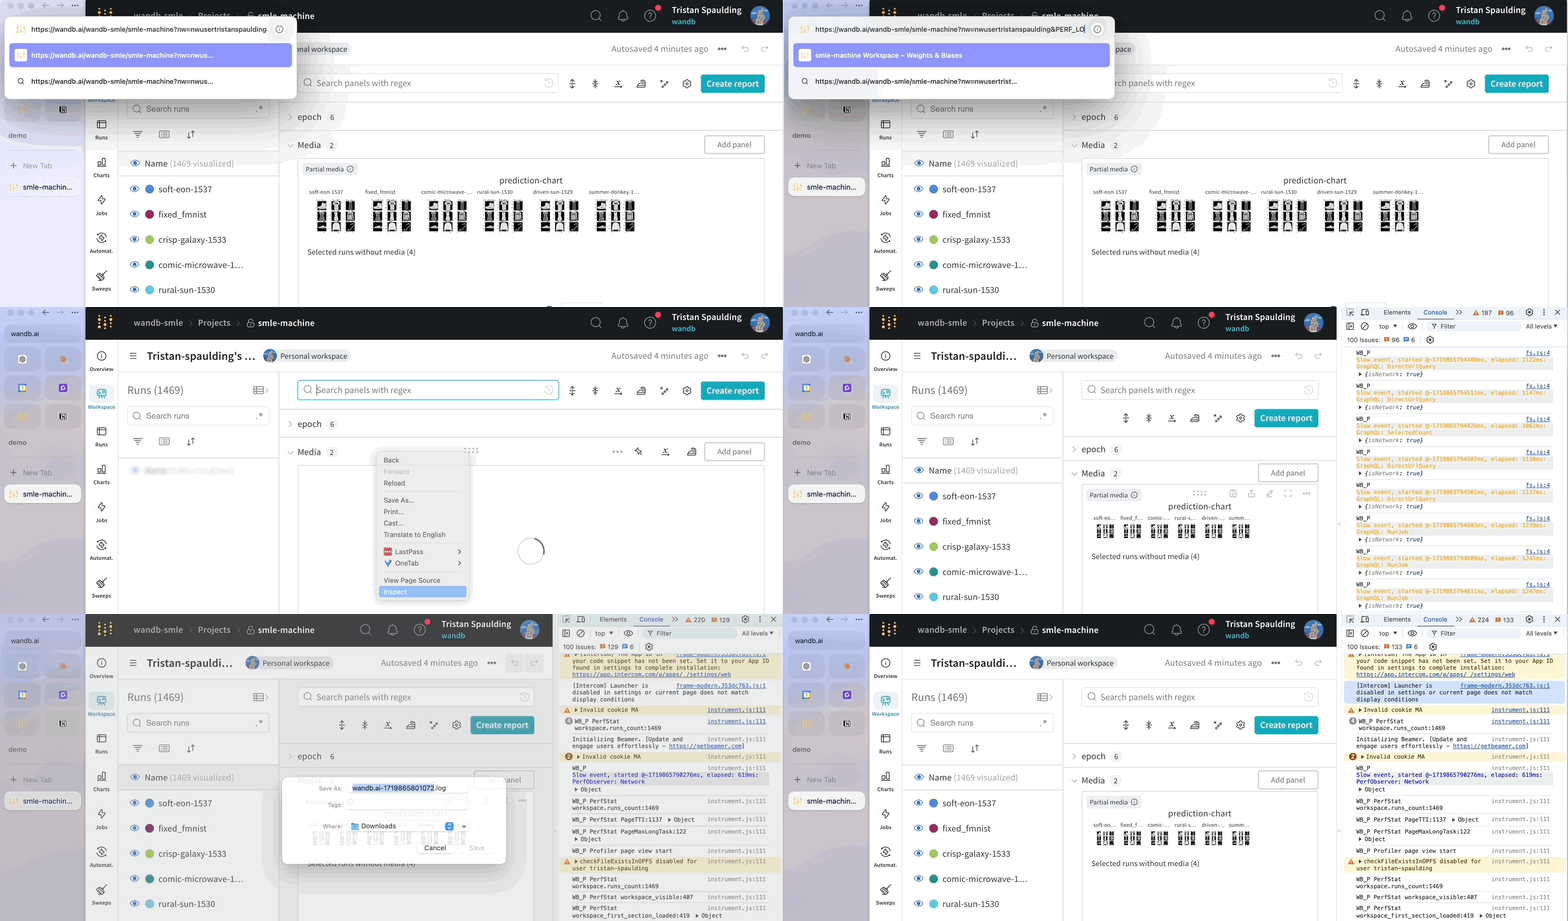
W&B takes performance seriously and investigates every report of lag. To expedite investigation, when reporting slow loading times consider invoking our built-in performance logger that captures key metrics and performance events. Append &PERF_LOGGING to your URL, and share the output of your console.
