Project Page
The project Workspace gives you a personal sandbox to compare experiments. Use projects to organize models that can be compared, working on the same problem with different architectures, hyperparameters, datasets, preprocessing etc.
Project page tabs:
- Overview: snapshot of your project
- Workspace: personal visualization sandbox
- Table: bird's eye view of all runs
- Reports: saved snapshots of notes, runs, and graphs
- Sweeps: automated exploration and optimization
Overview Tab
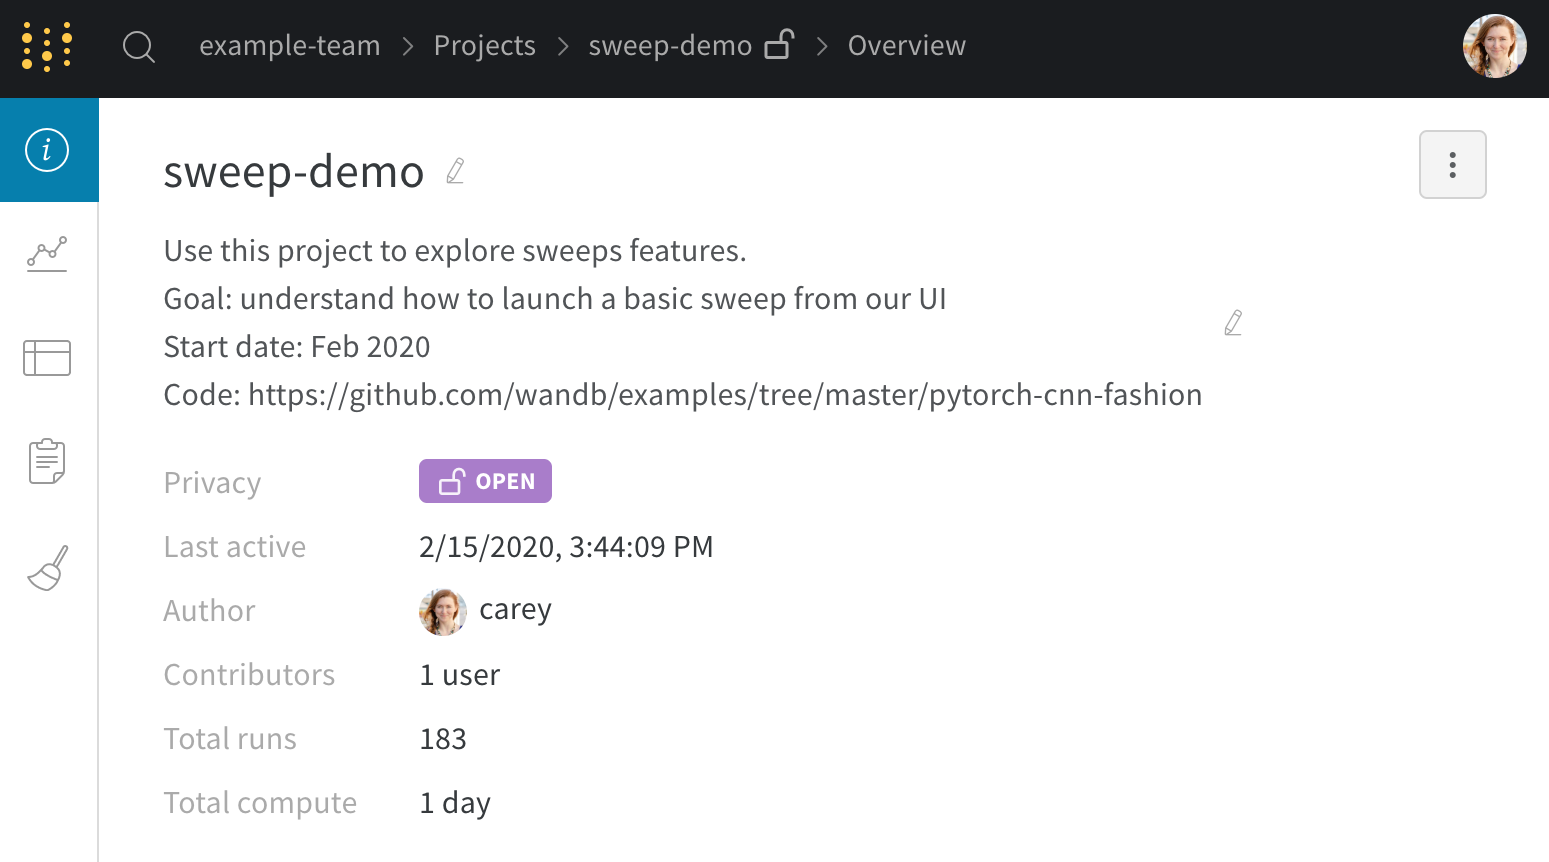
- Project name: click to edit the project name
- Project description: click to edit the project description and add notes
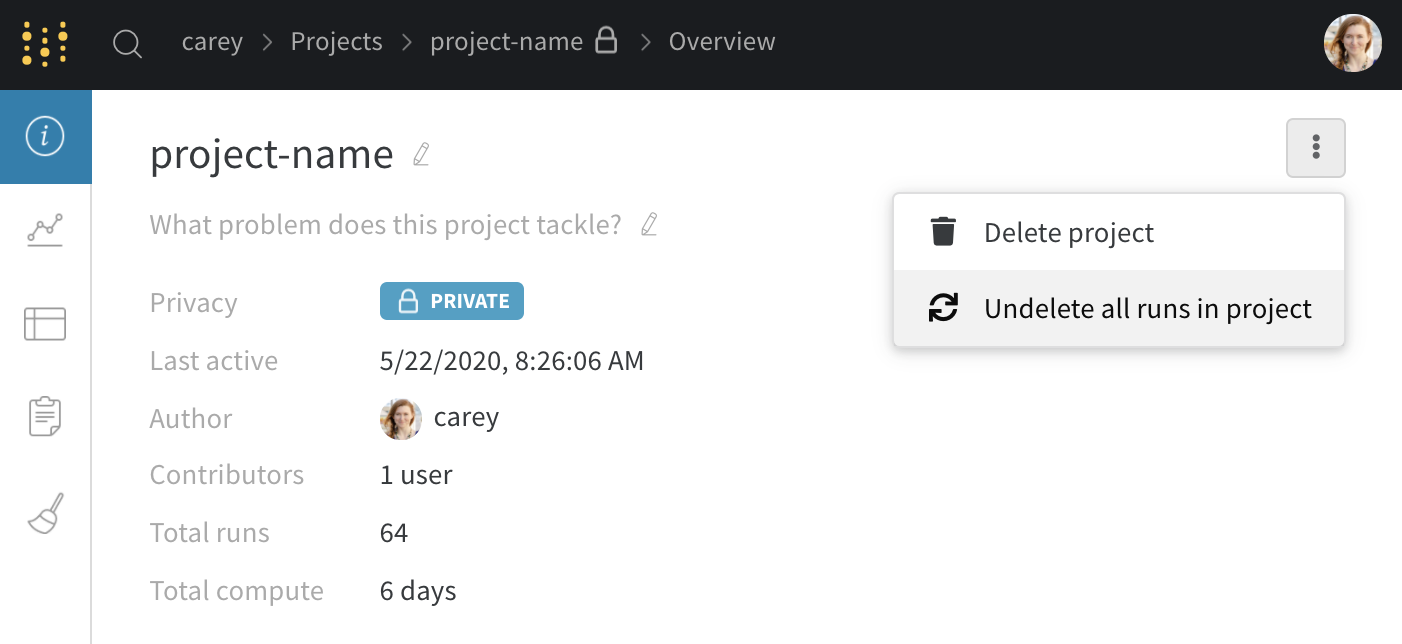
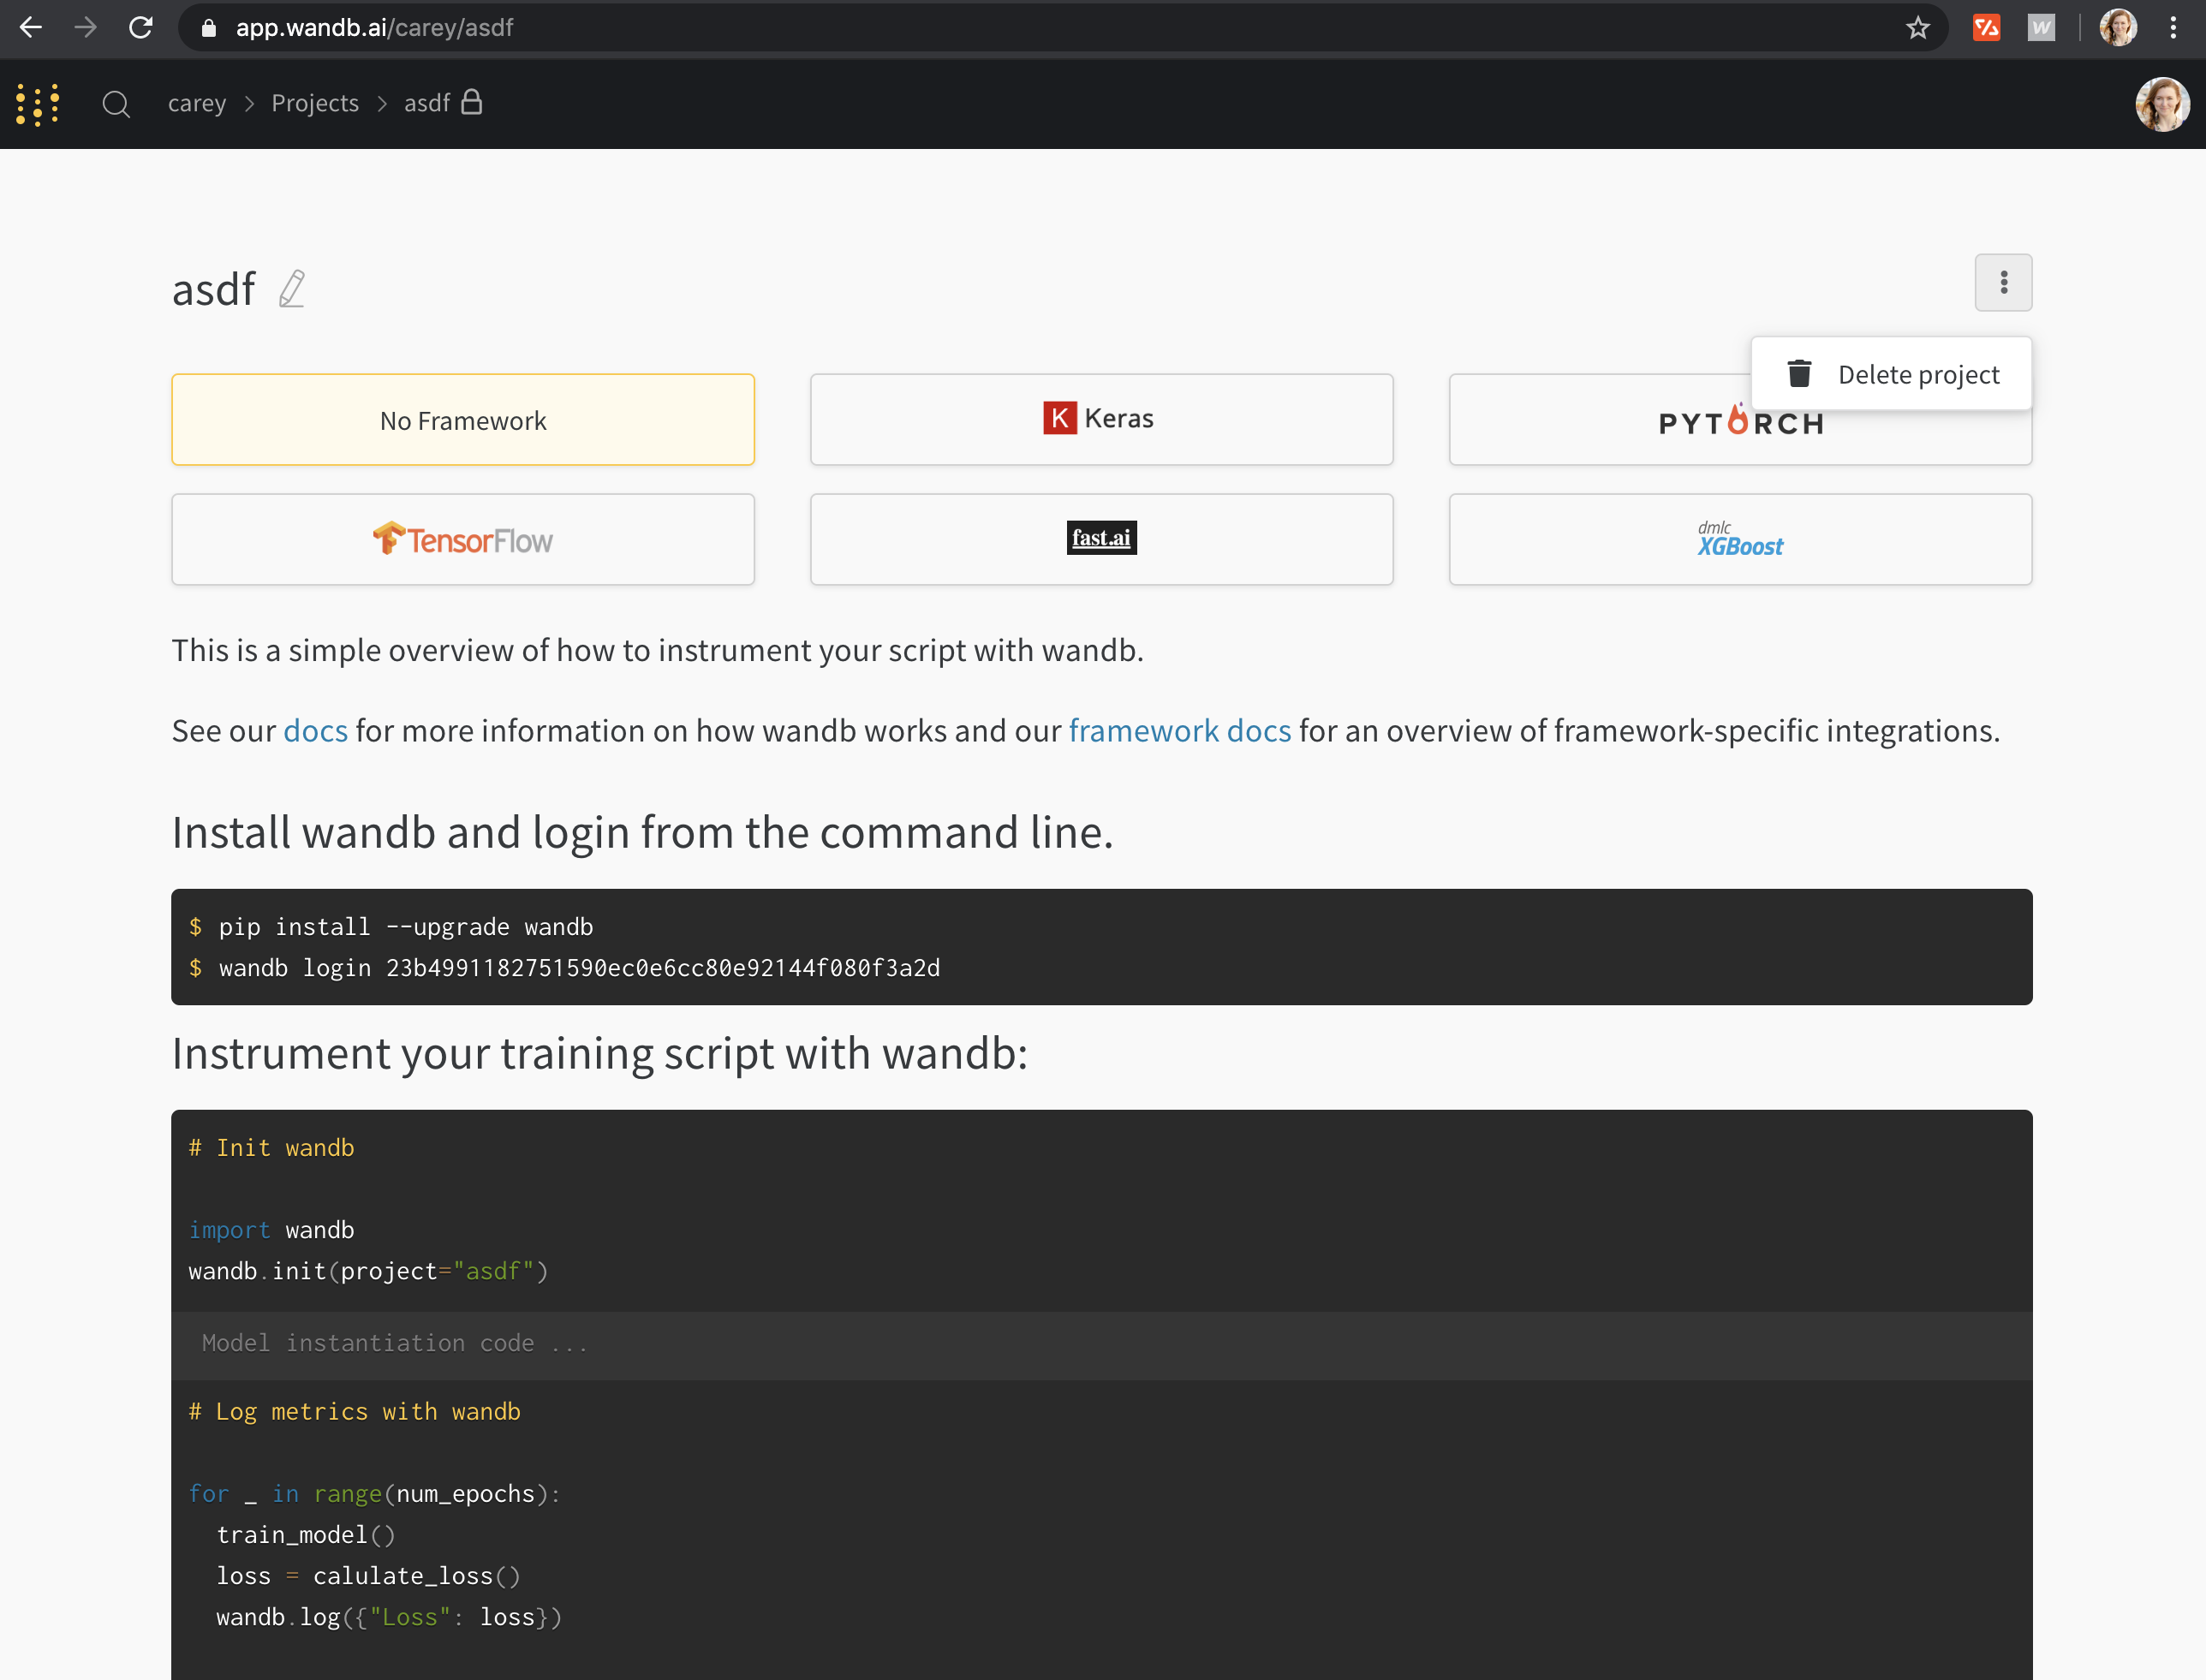
- Delete project: click the dot menu in the right corner to delete a project
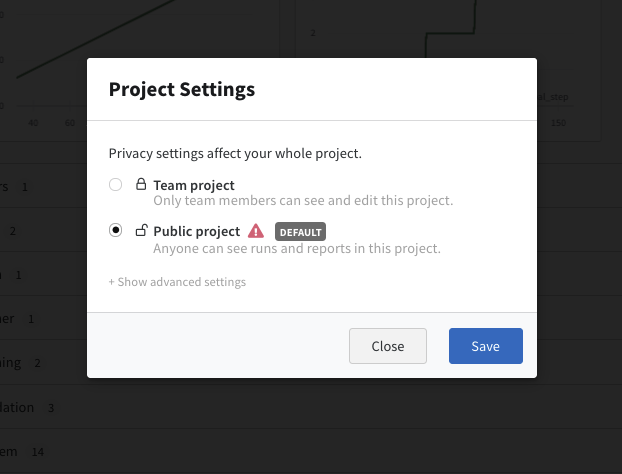
- Project privacy: edit who can view runs and reports— click the lock icon
- Last active: see when the most recent data was logged to this project
- Total compute: we add up all the run times in your project to get this total
- Undelete runs: Click the dropdown menu and click "Undelete all runs" to recover deleted runs in your project.
Workspace Tab
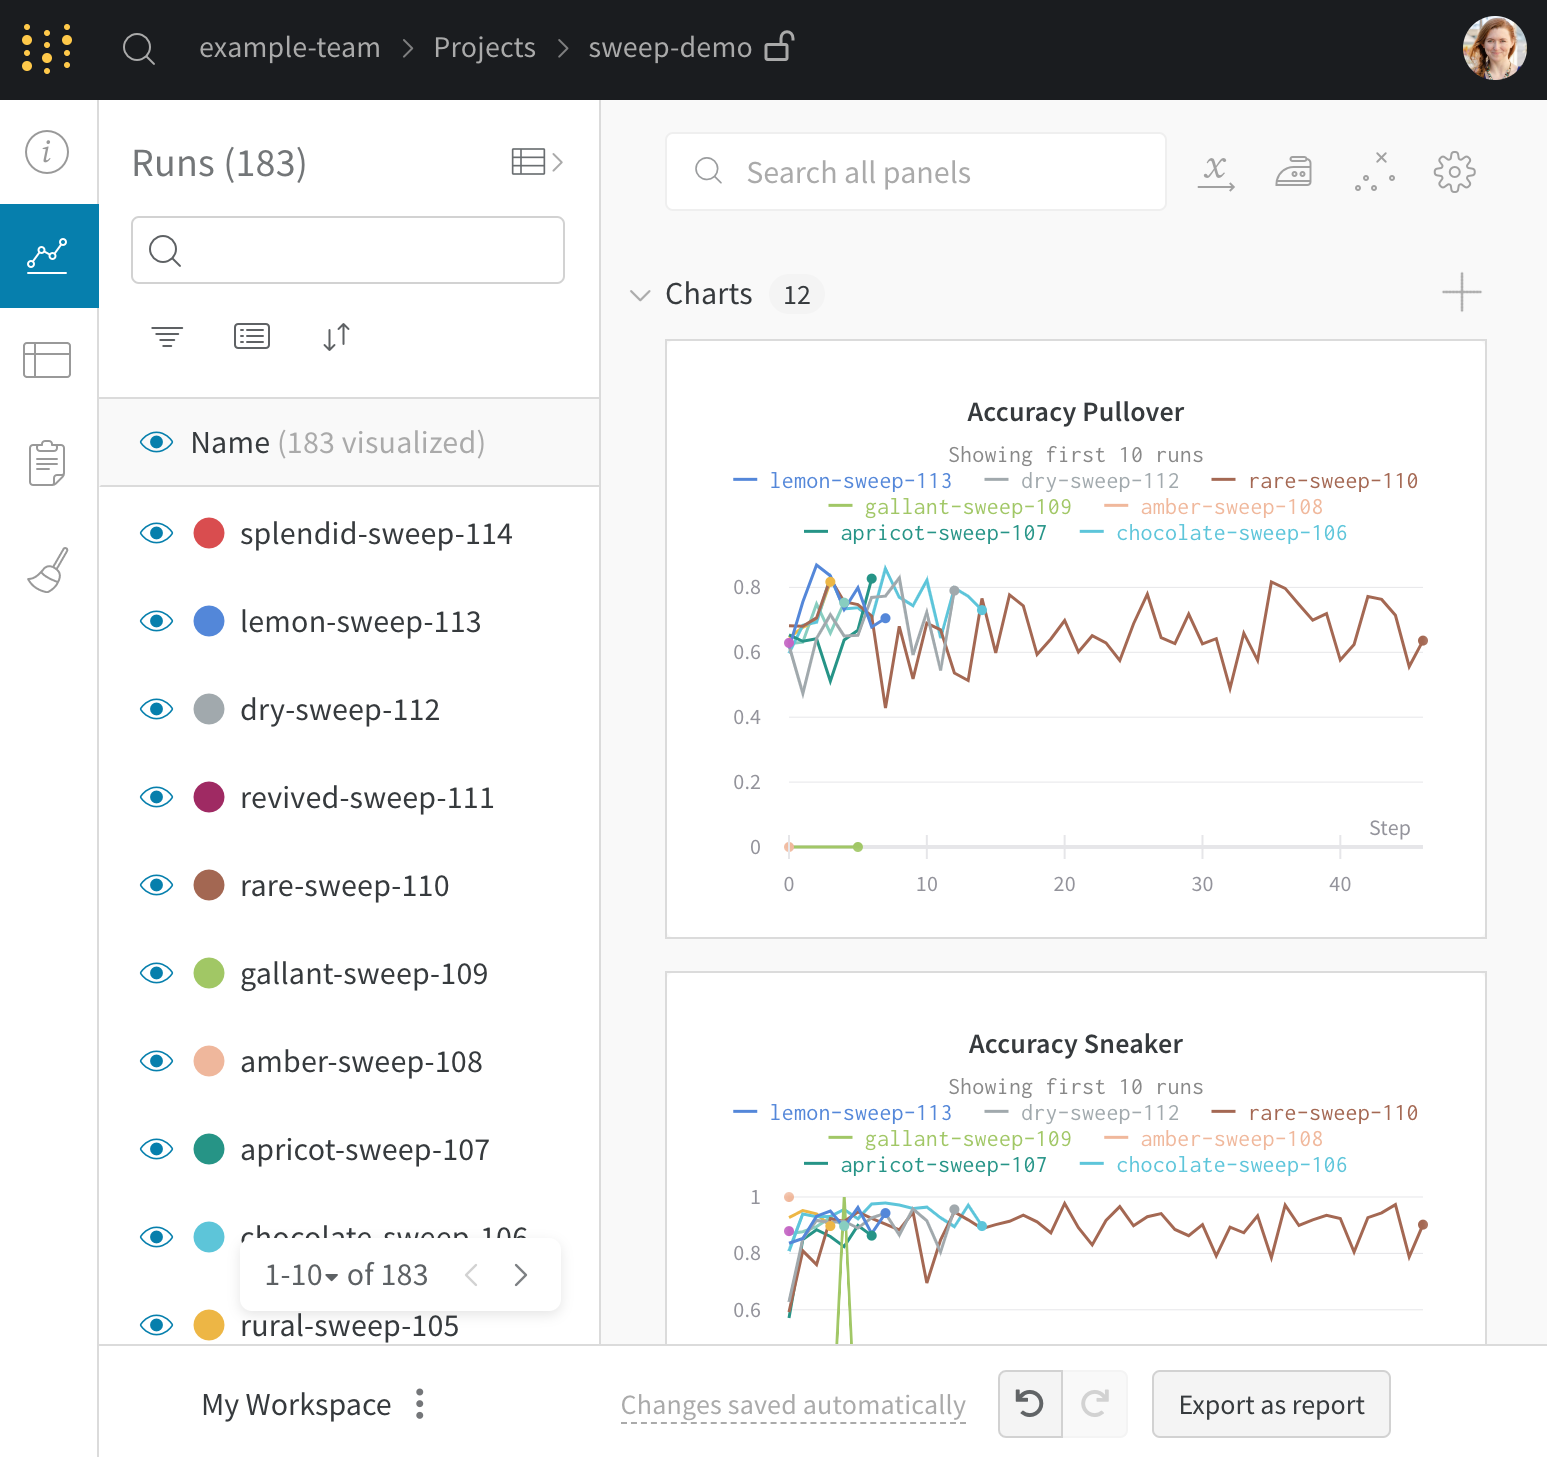
Runs Sidebar: list of all the runs in your project
- Dot menu: hover over a row in the sidebar to see the menu appear on the left side. Use this menu to rename a run, delete a run, or stop and active run.
- Visibility icon: click the eye to turn on and off runs on graphs
- Color: change the run color to another one of our presets or a custom color
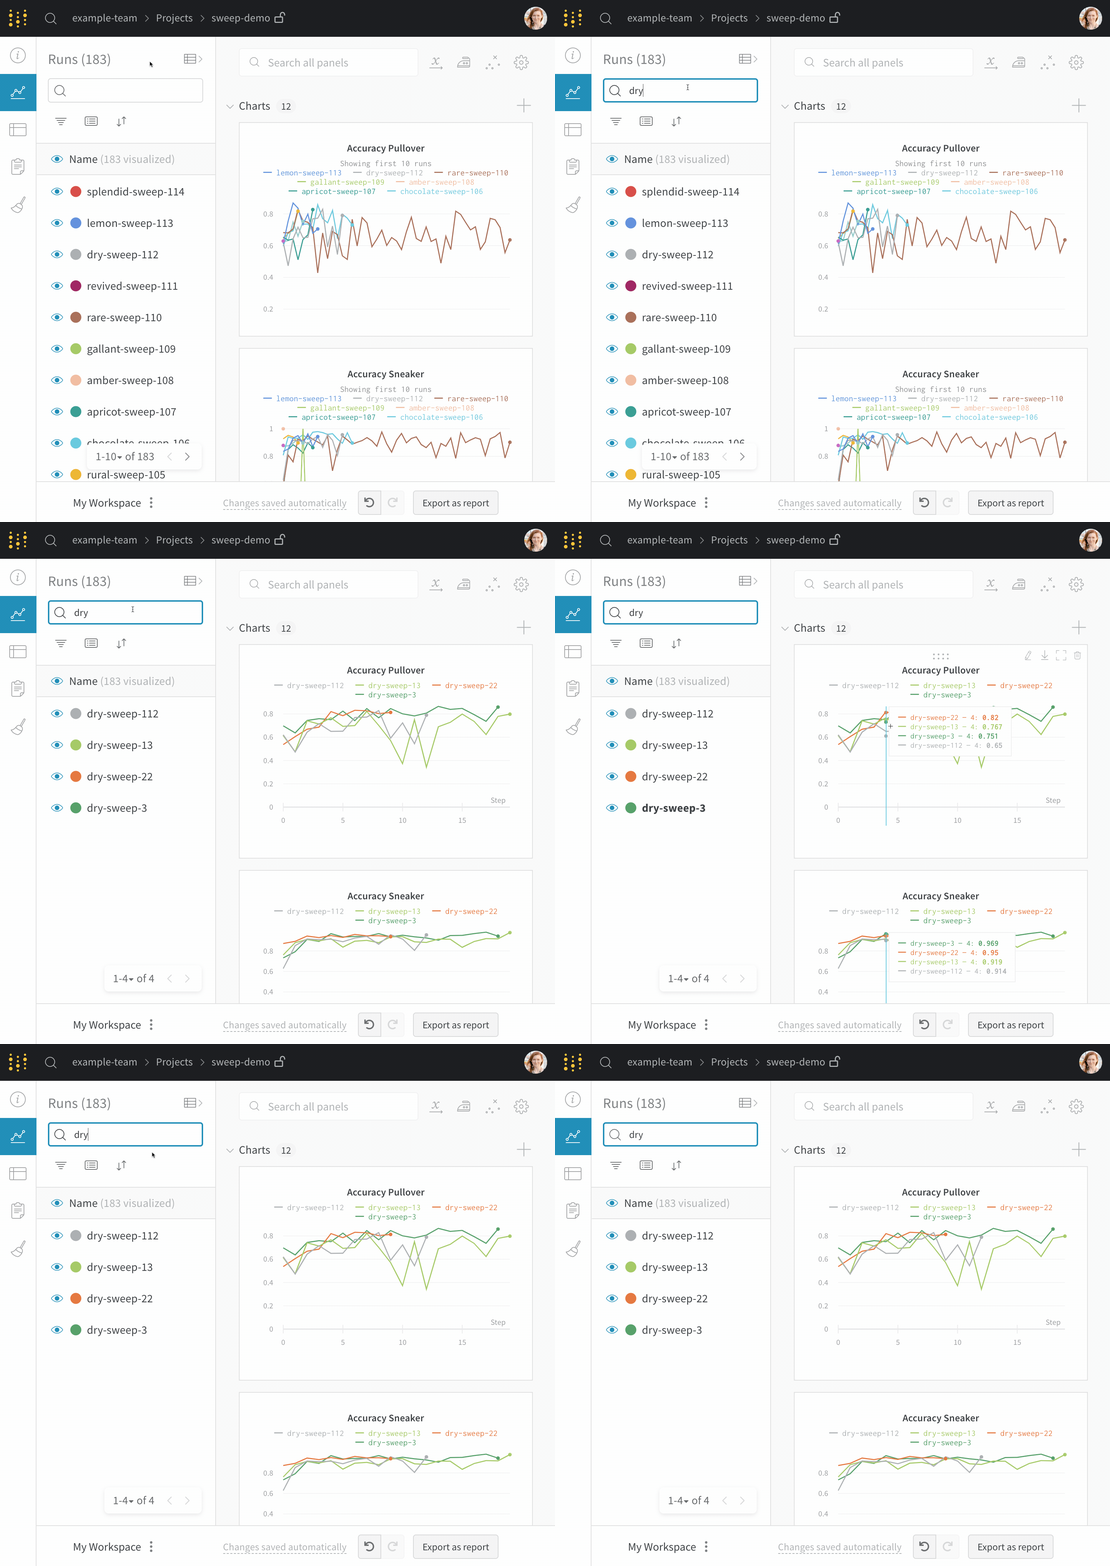
- Search: search runs by name. This also filters visible runs in the plots.
- Filter: use the sidebar filter to narrow down the set of runs visible
- Group: select a config column to dynamically group your runs, for example by architecture. Grouping makes plots show up with a line along the mean value, and a shaded region for the variance of points on the graph.
- Sort: pick a value to sort your runs by, for example runs with the lowest loss or highest accuracy. Sorting will affect which runs show up on the graphs.
- Expand button: expand the sidebar into the full table
- Run count: the number in parentheses at the top is the total number of runs in the project. The number (N visualized) is the number of runs that have the eye turned on and are available to be visualized in each plot. In the example below, the graphs are only showing the first 10 of 183 runs. Edit a graph to increase the max number of runs visible.
Panels layout: use this scratch space to explore results, add and remove charts, and compare versions of your models based on different metrics
Search for runs
Search for a run by name in the sidebar. You can use regex to filter down your visible runs. The search box affects which runs are shown on the graph. Here's an example:
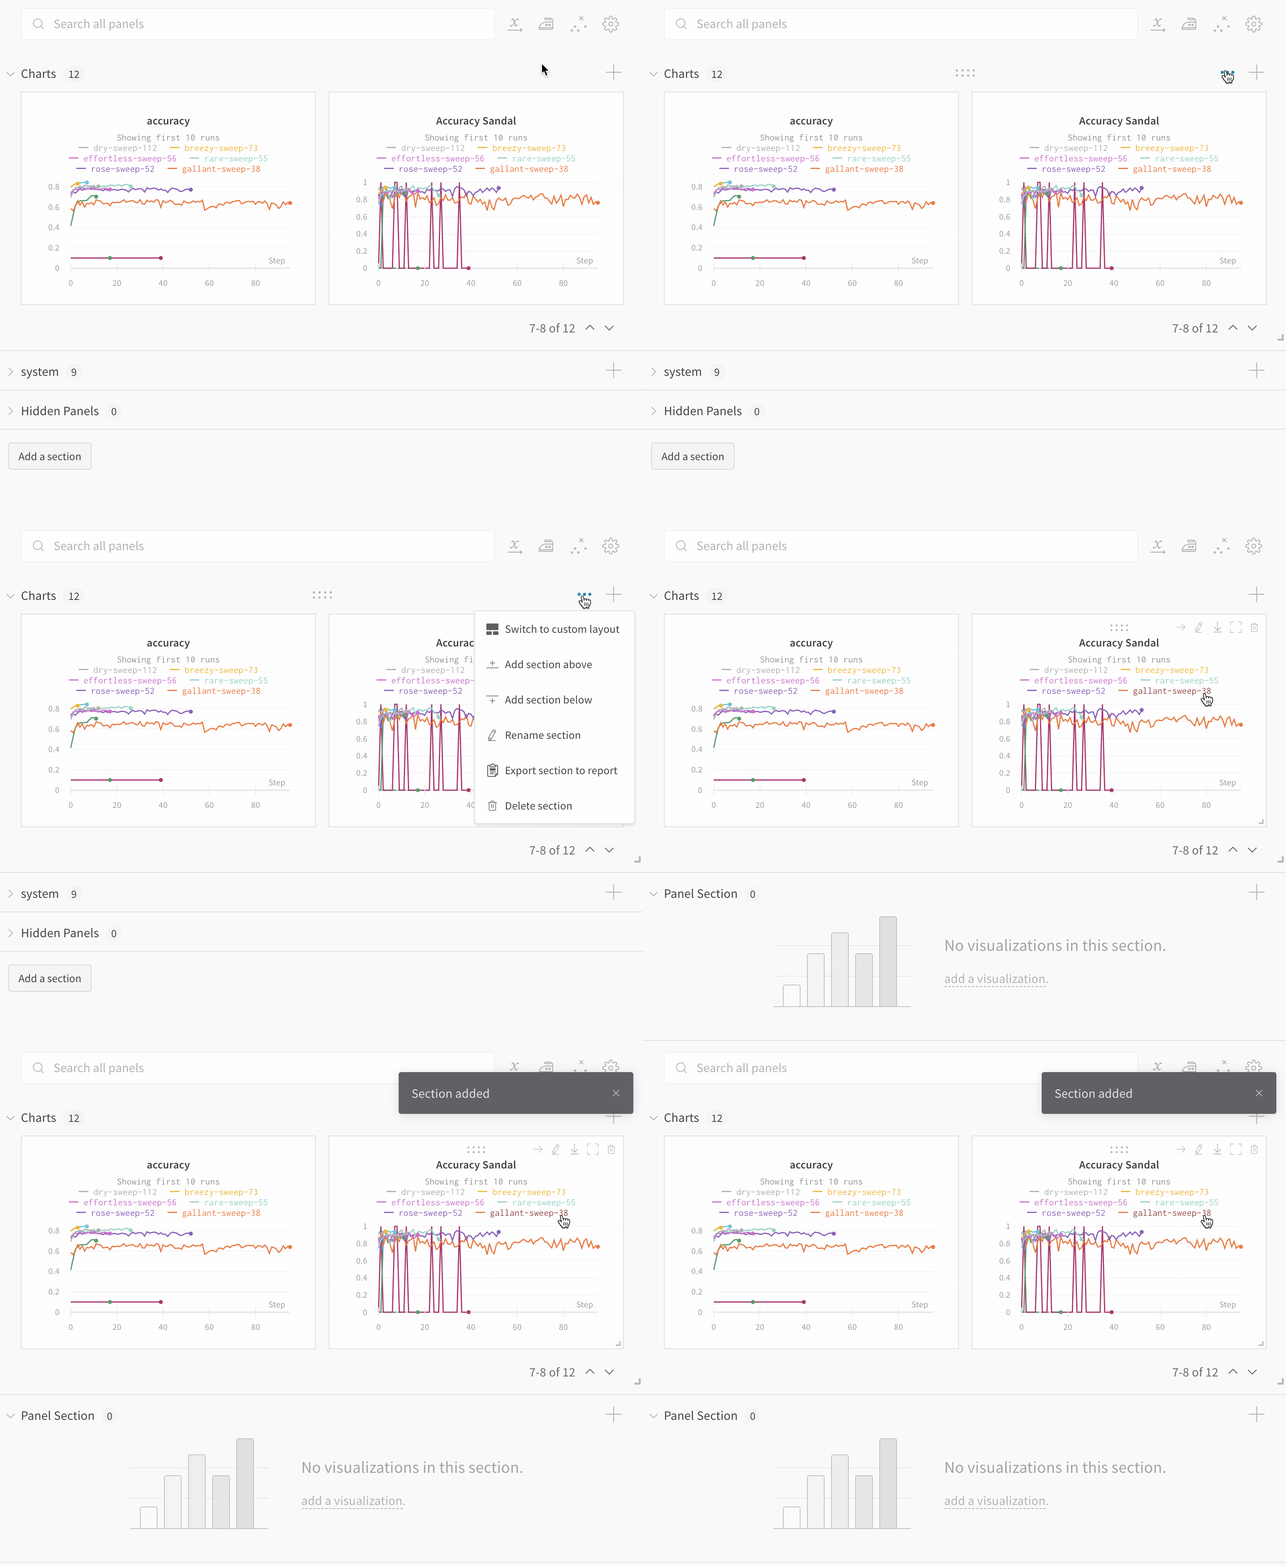
Add a section of panels
Click the section dropdown menu and click "Add section" to create a new section for panels. You can rename sections, drag them to reorganize them, and expand and collapse sections.
Each section has options in the upper right corner:
- Switch to custom layout: The custom layout allows you to resize panels individually.
- Switch to standard layout: The standard layout lets you resize all panels in the section at once, and gives you pagination.
- Add section: Add a section above or below from the dropdown menu, or click the button at the bottom of the page to add a new section.
- Rename section: Change the title for your section.
- Export section to report: Save this section of panels to a new report.
- Delete section: Remove the whole section and all the charts. This can be undone with the undo button at the bottom of the page in the workspace bar.
- Add panel: Click the plus button to add a panel to the section.
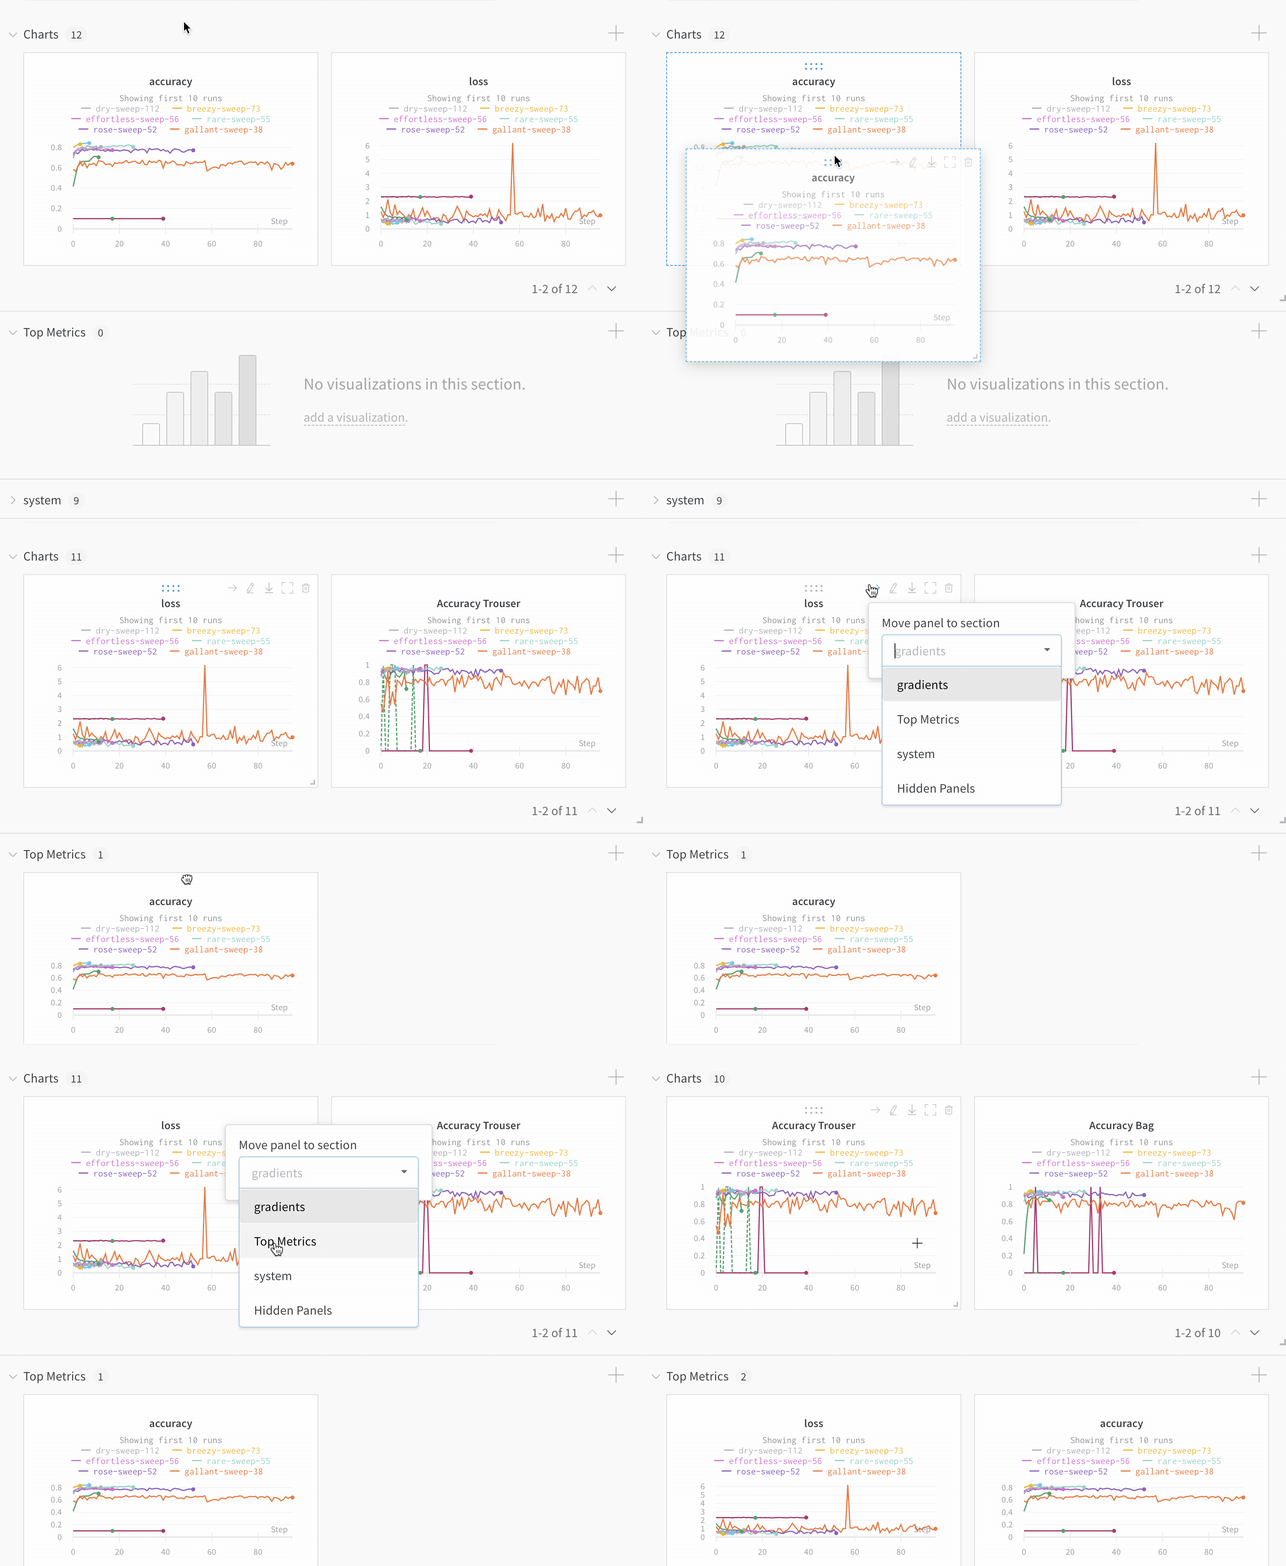
Move panels between sections
Drag and drop panels to reorder and organize into sections. You can also click the "Move" button in the upper right corner of a panel to select a section to move the panel to.
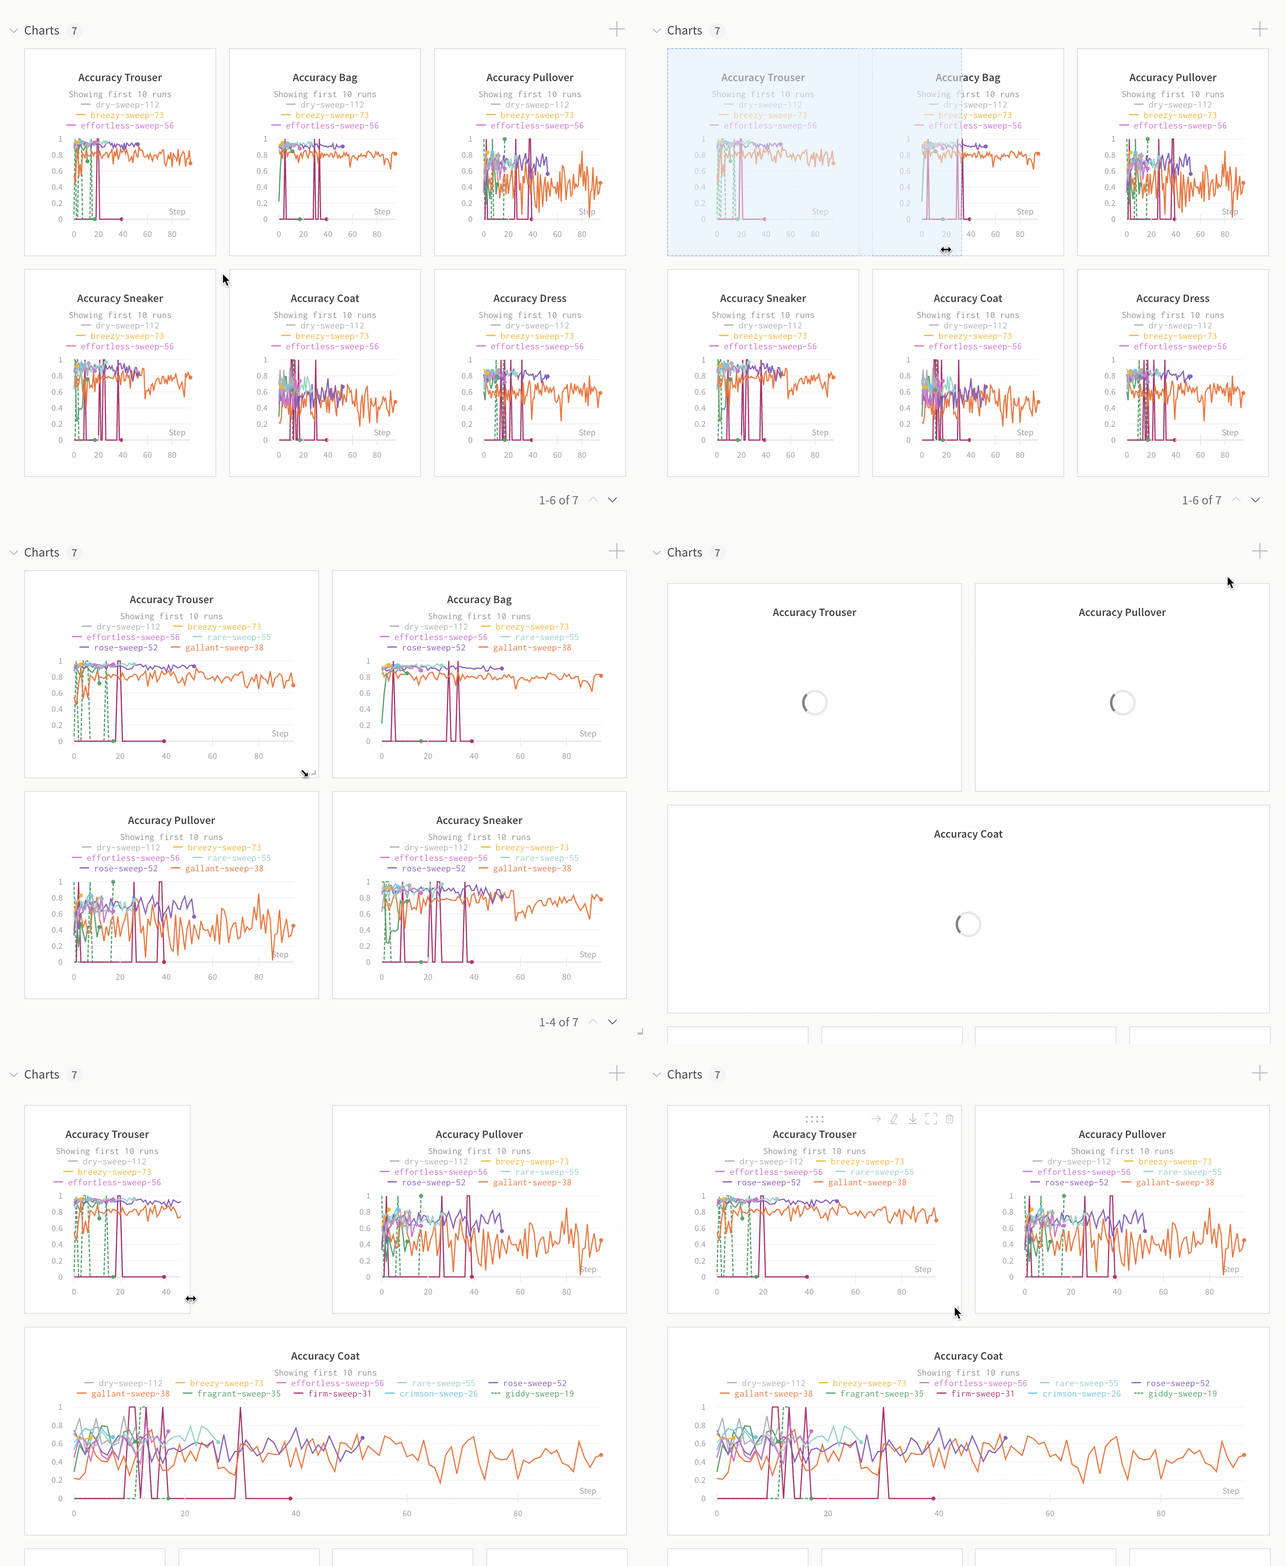
Resize panels
- Standard layout: All panels maintain the same size, and there are pages of panels. You can resize the panels by clicking and dragging the lower right corner. Resize the section by clicking and dragging the lower right corner of the section.
- Custom layout: All panels are sized individually, and there are no pages.
Search for metrics
Use the search box in the workspace to filter down the panels. This search matches the panel titles, which are by default the name of the metrics visualized.
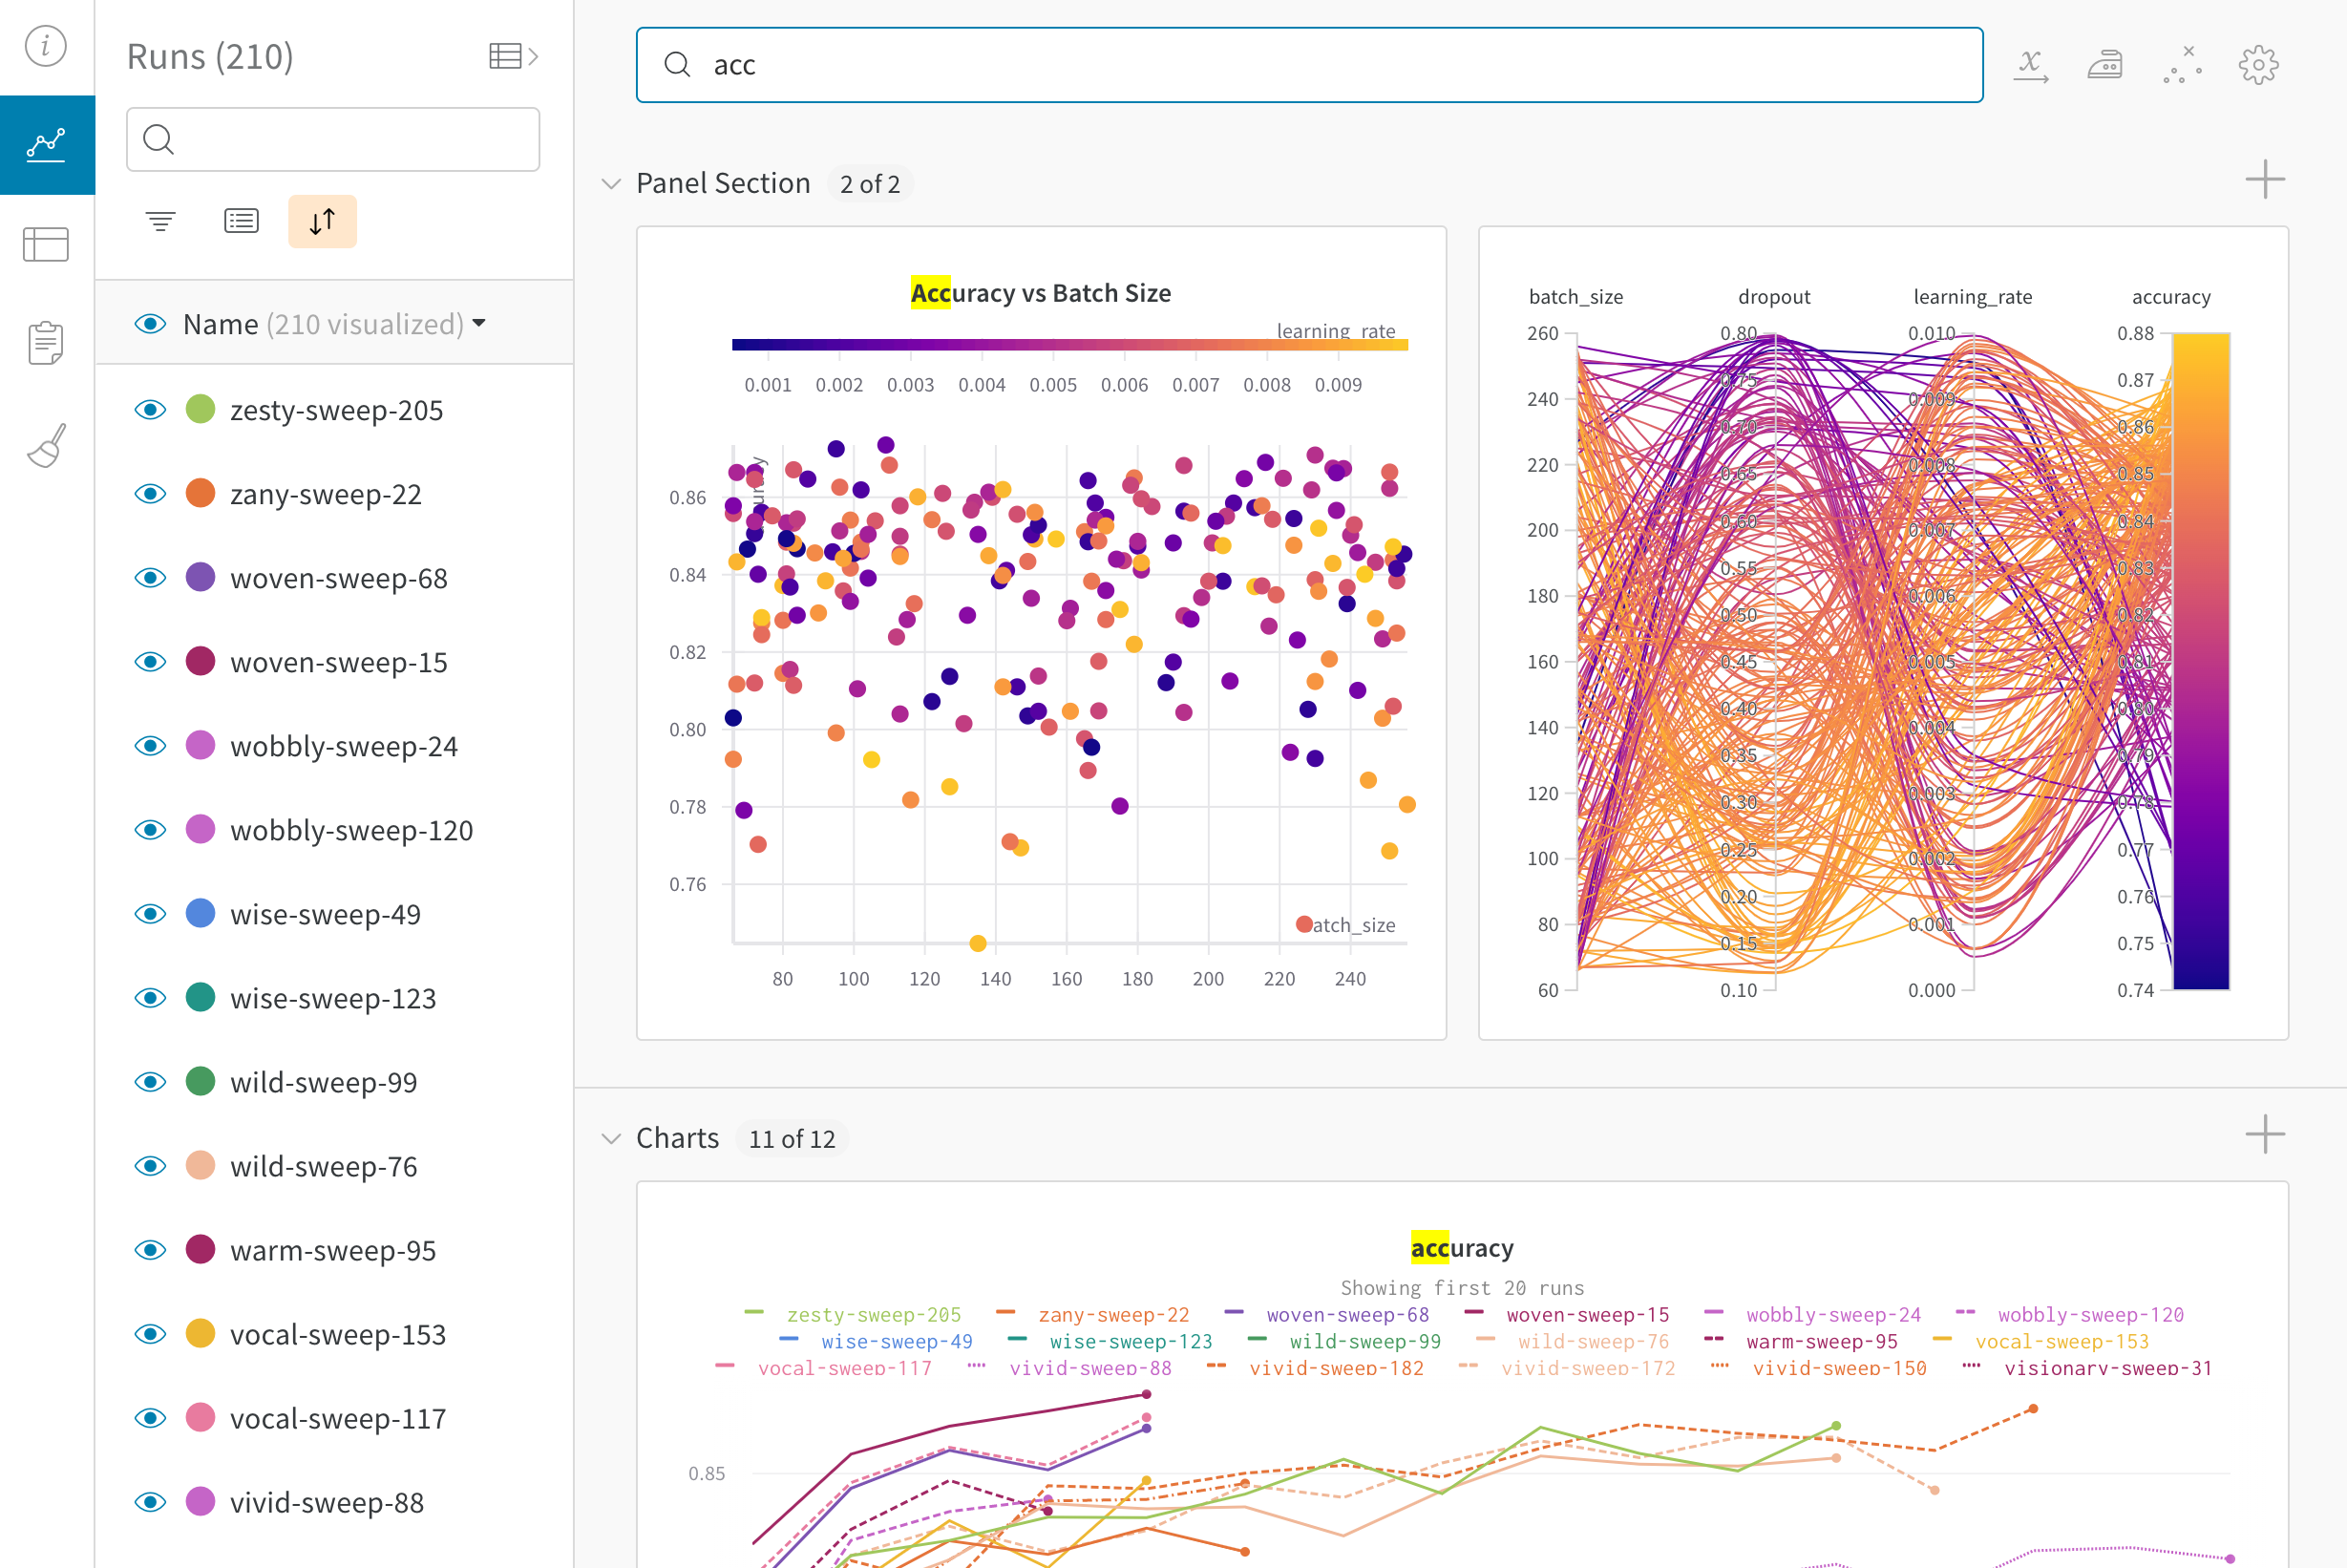
Table Tab
Use the table to filter, group, and sort your results.
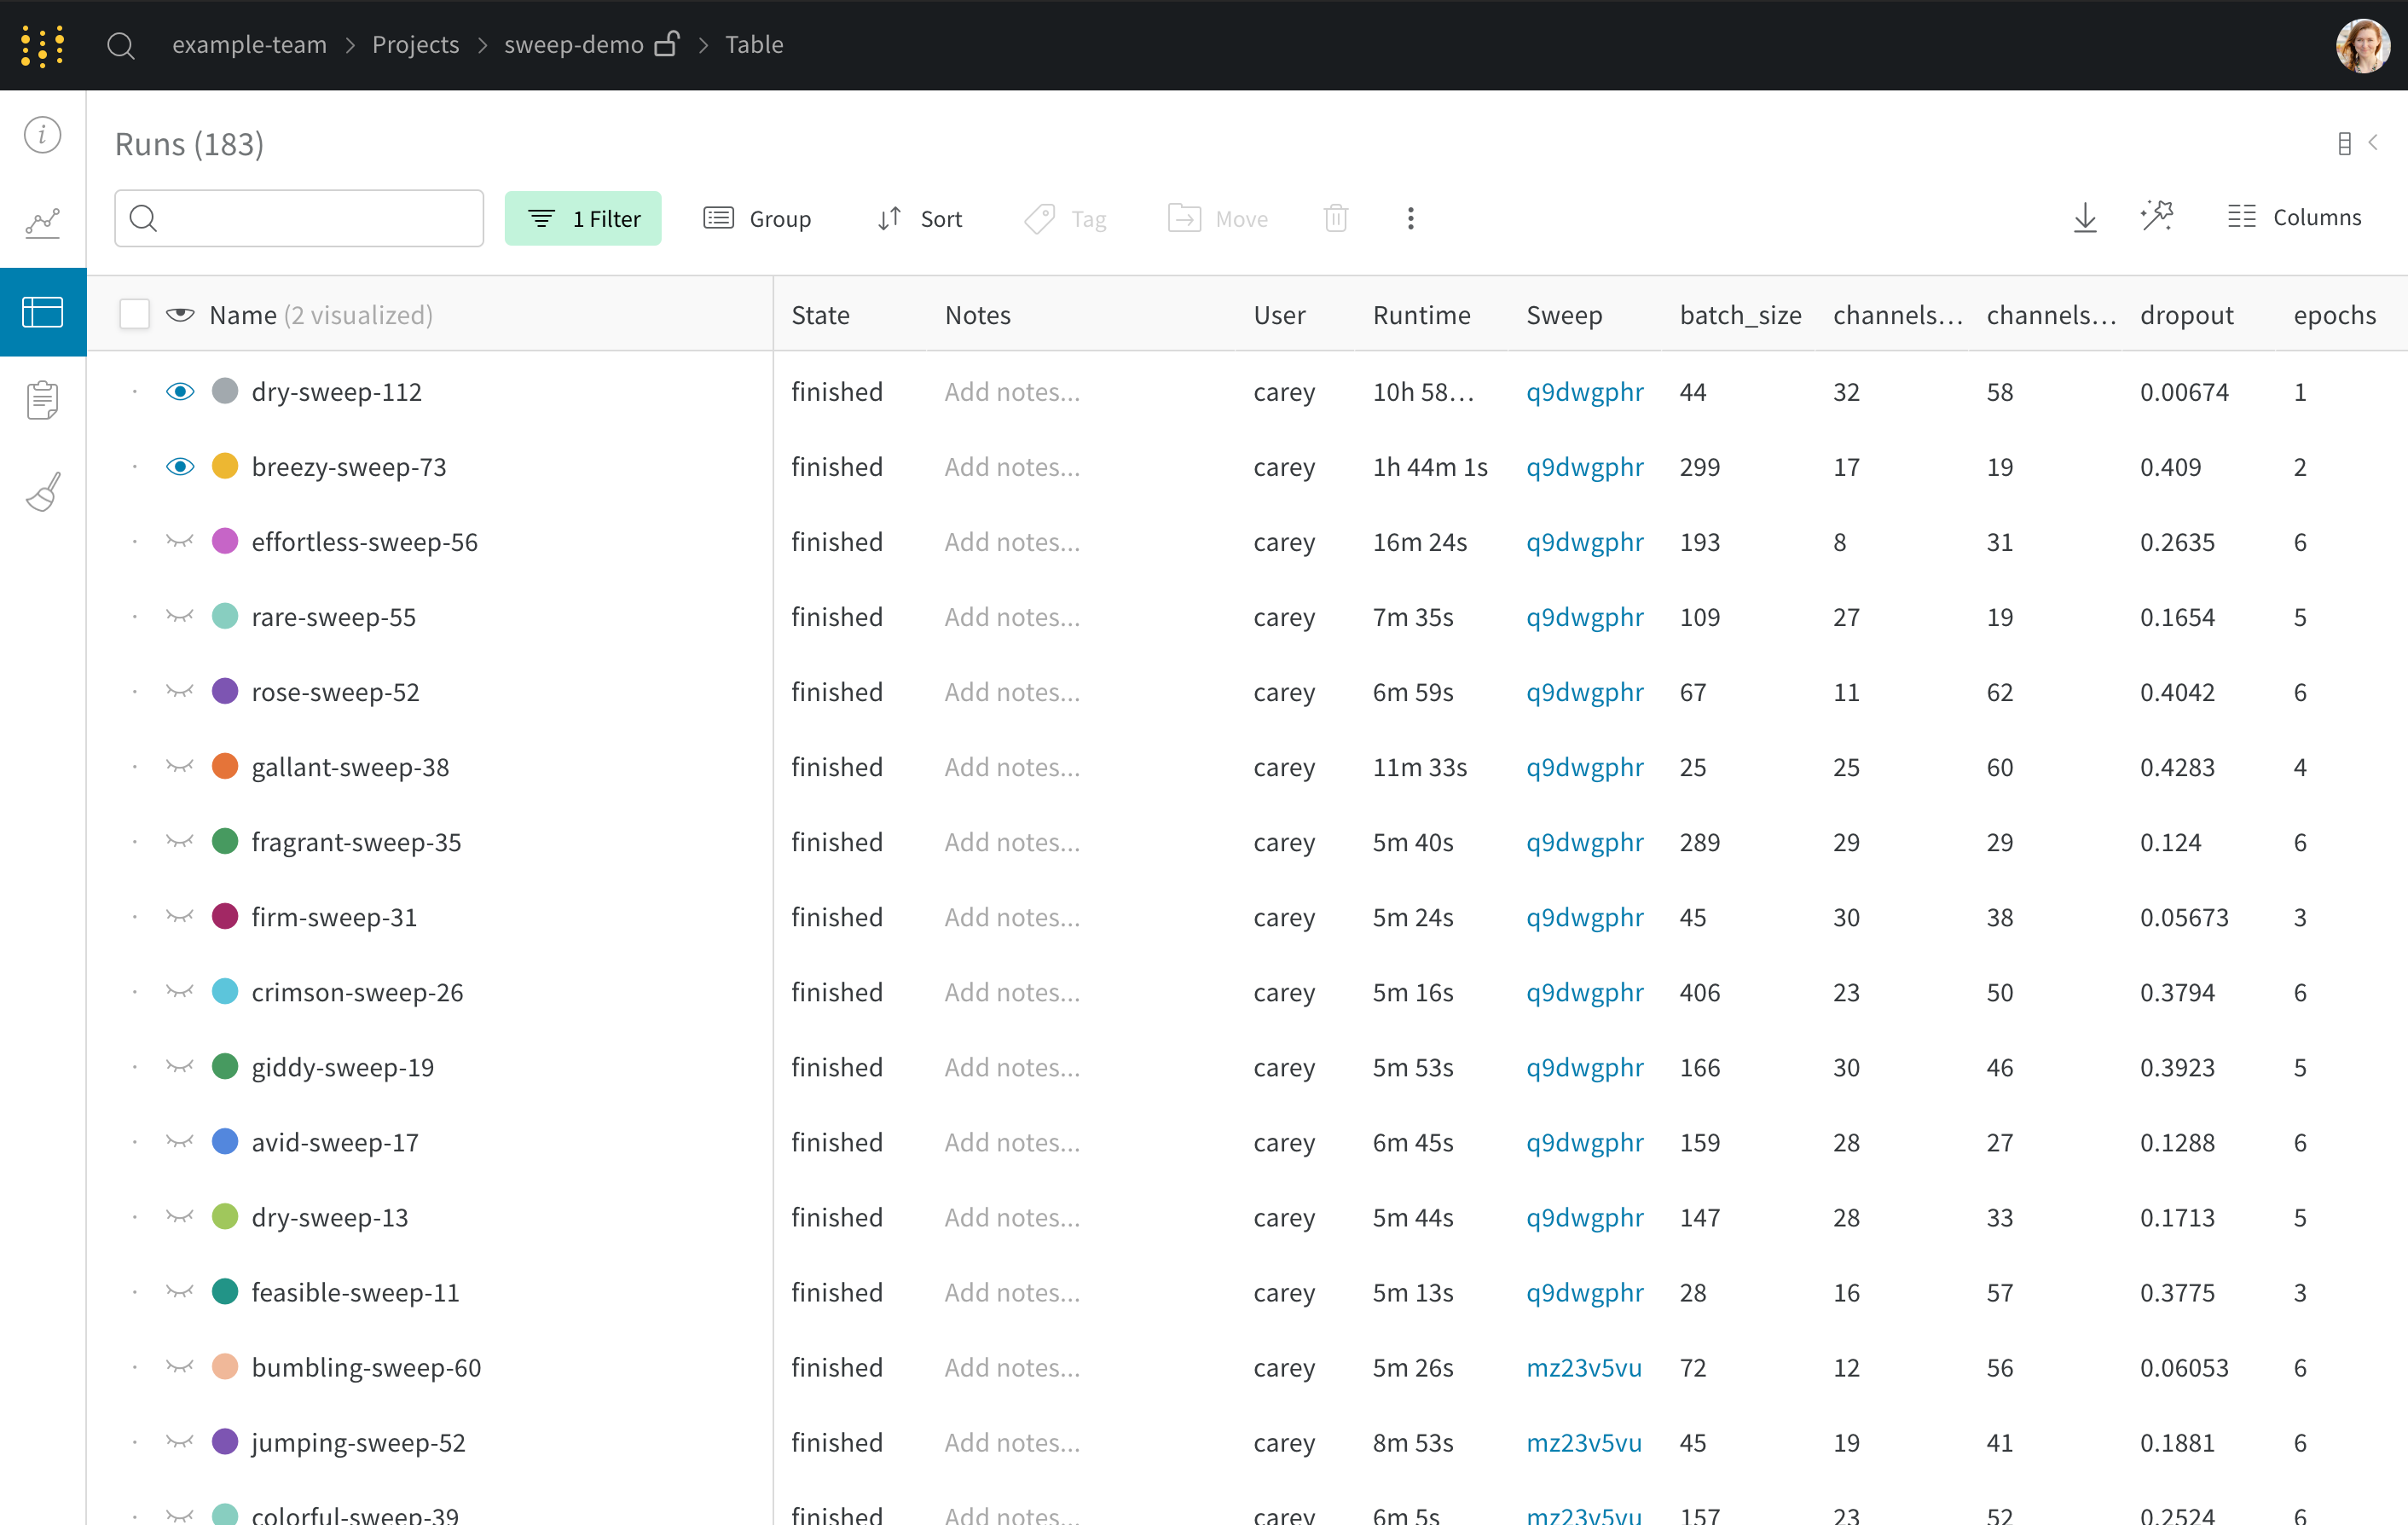
Table operations
Use the W&B App to sort, filter, and group your W&B Tables.
- Sort
- Filter
- Group
Sort all rows in a Table by the value in a given column.
- Hover your mouse over the column title. A kebob menu will appear (three vertical docs).
- Select on the kebob menu (three vertical dots).
- Choose Sort Asc or Sort Desc to sort the rows in ascending or descending order, respectively.
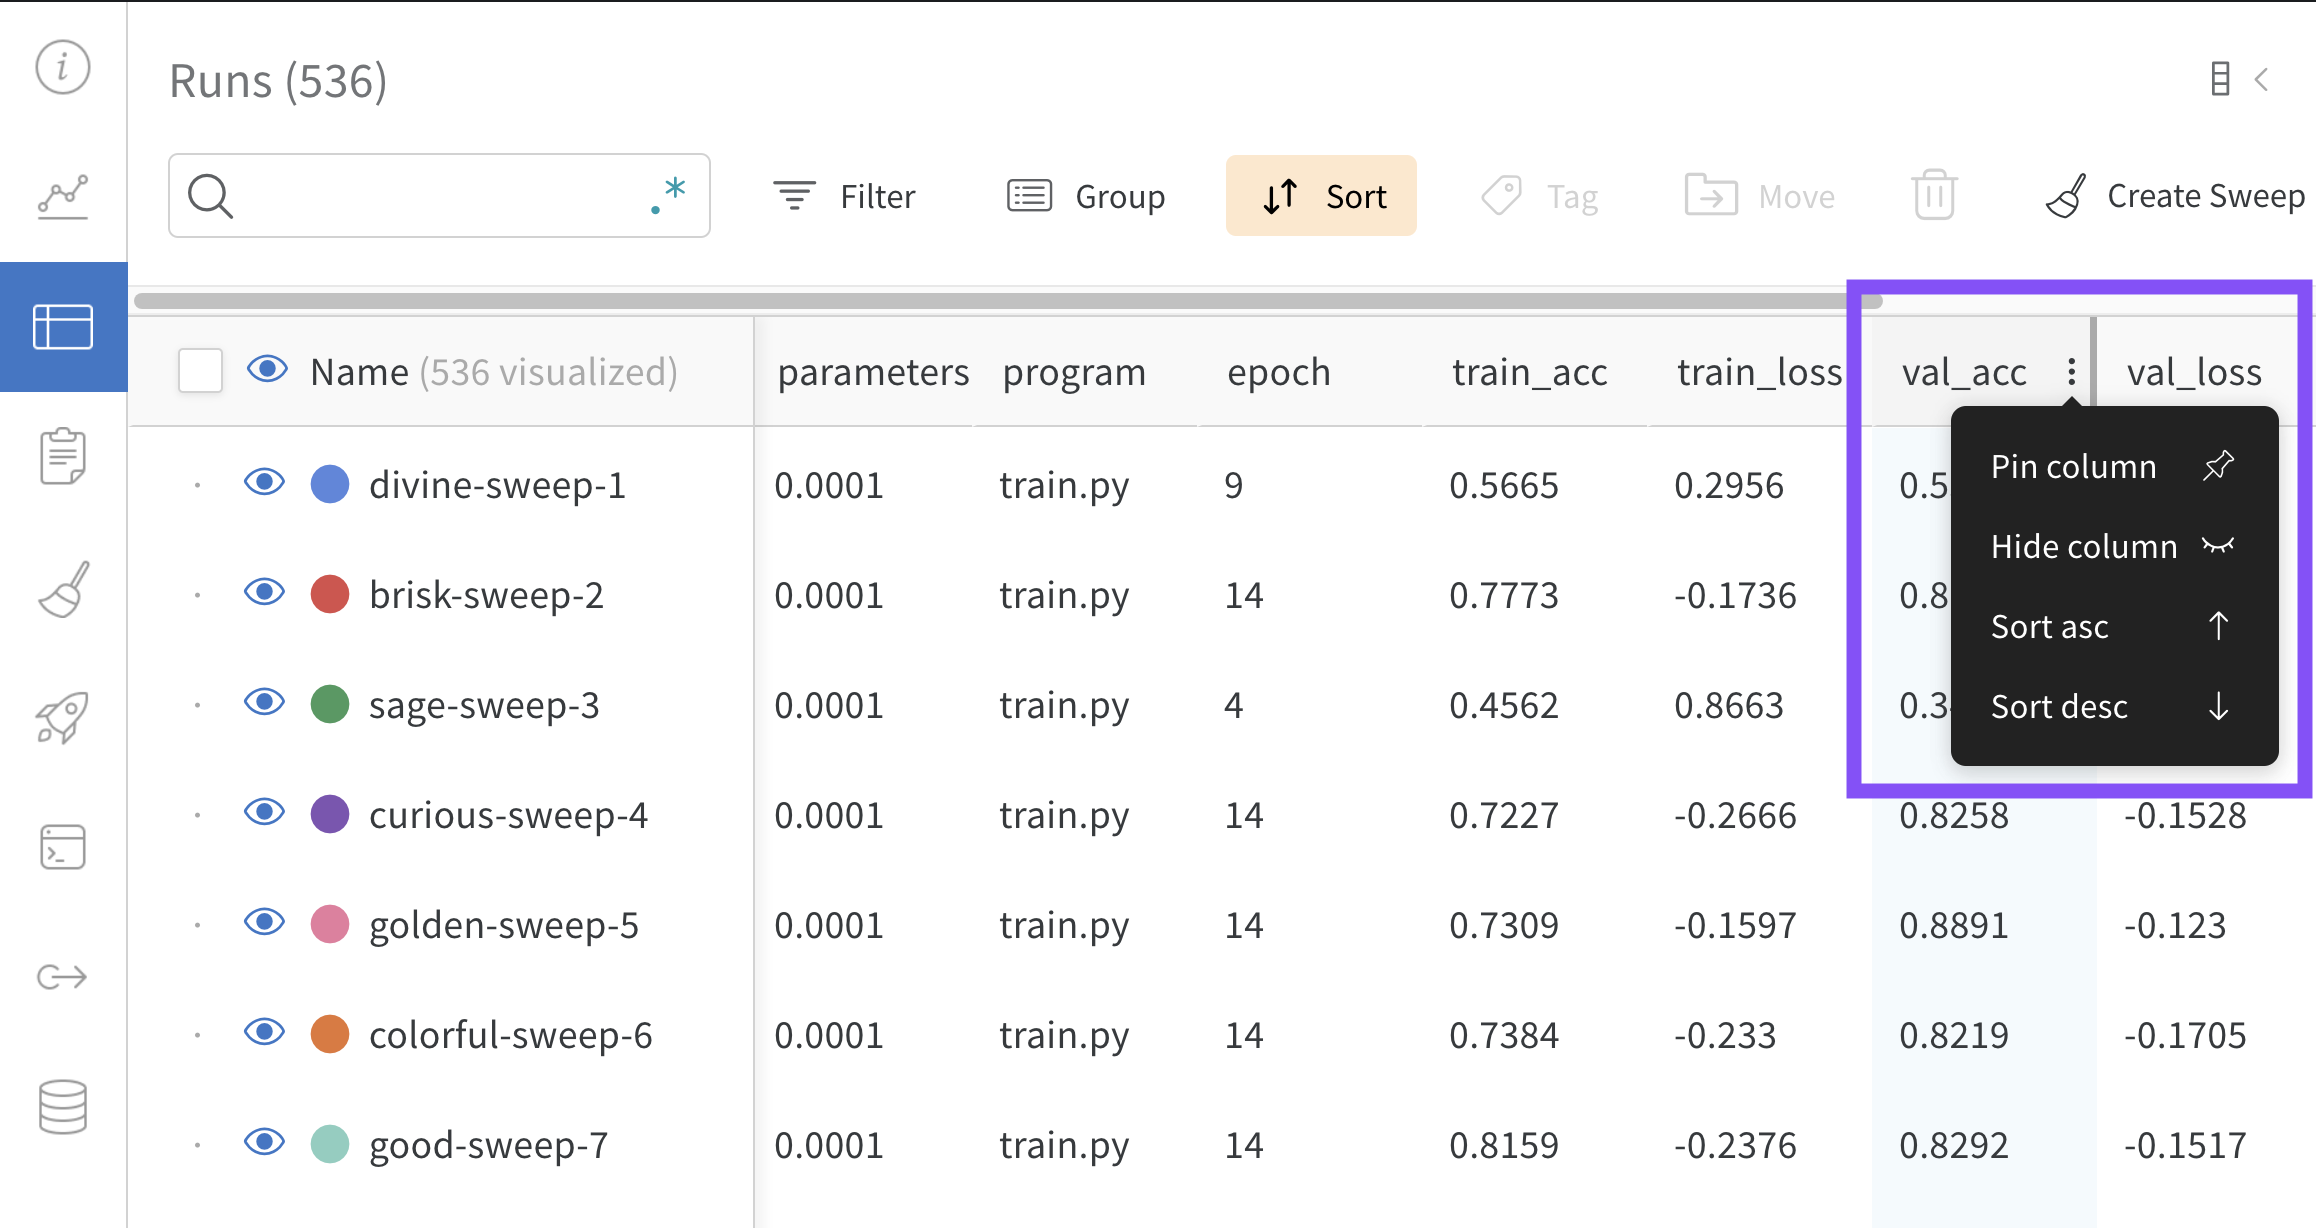
The preceding image demonstrates how to view sorting options for a Table column called val_acc.
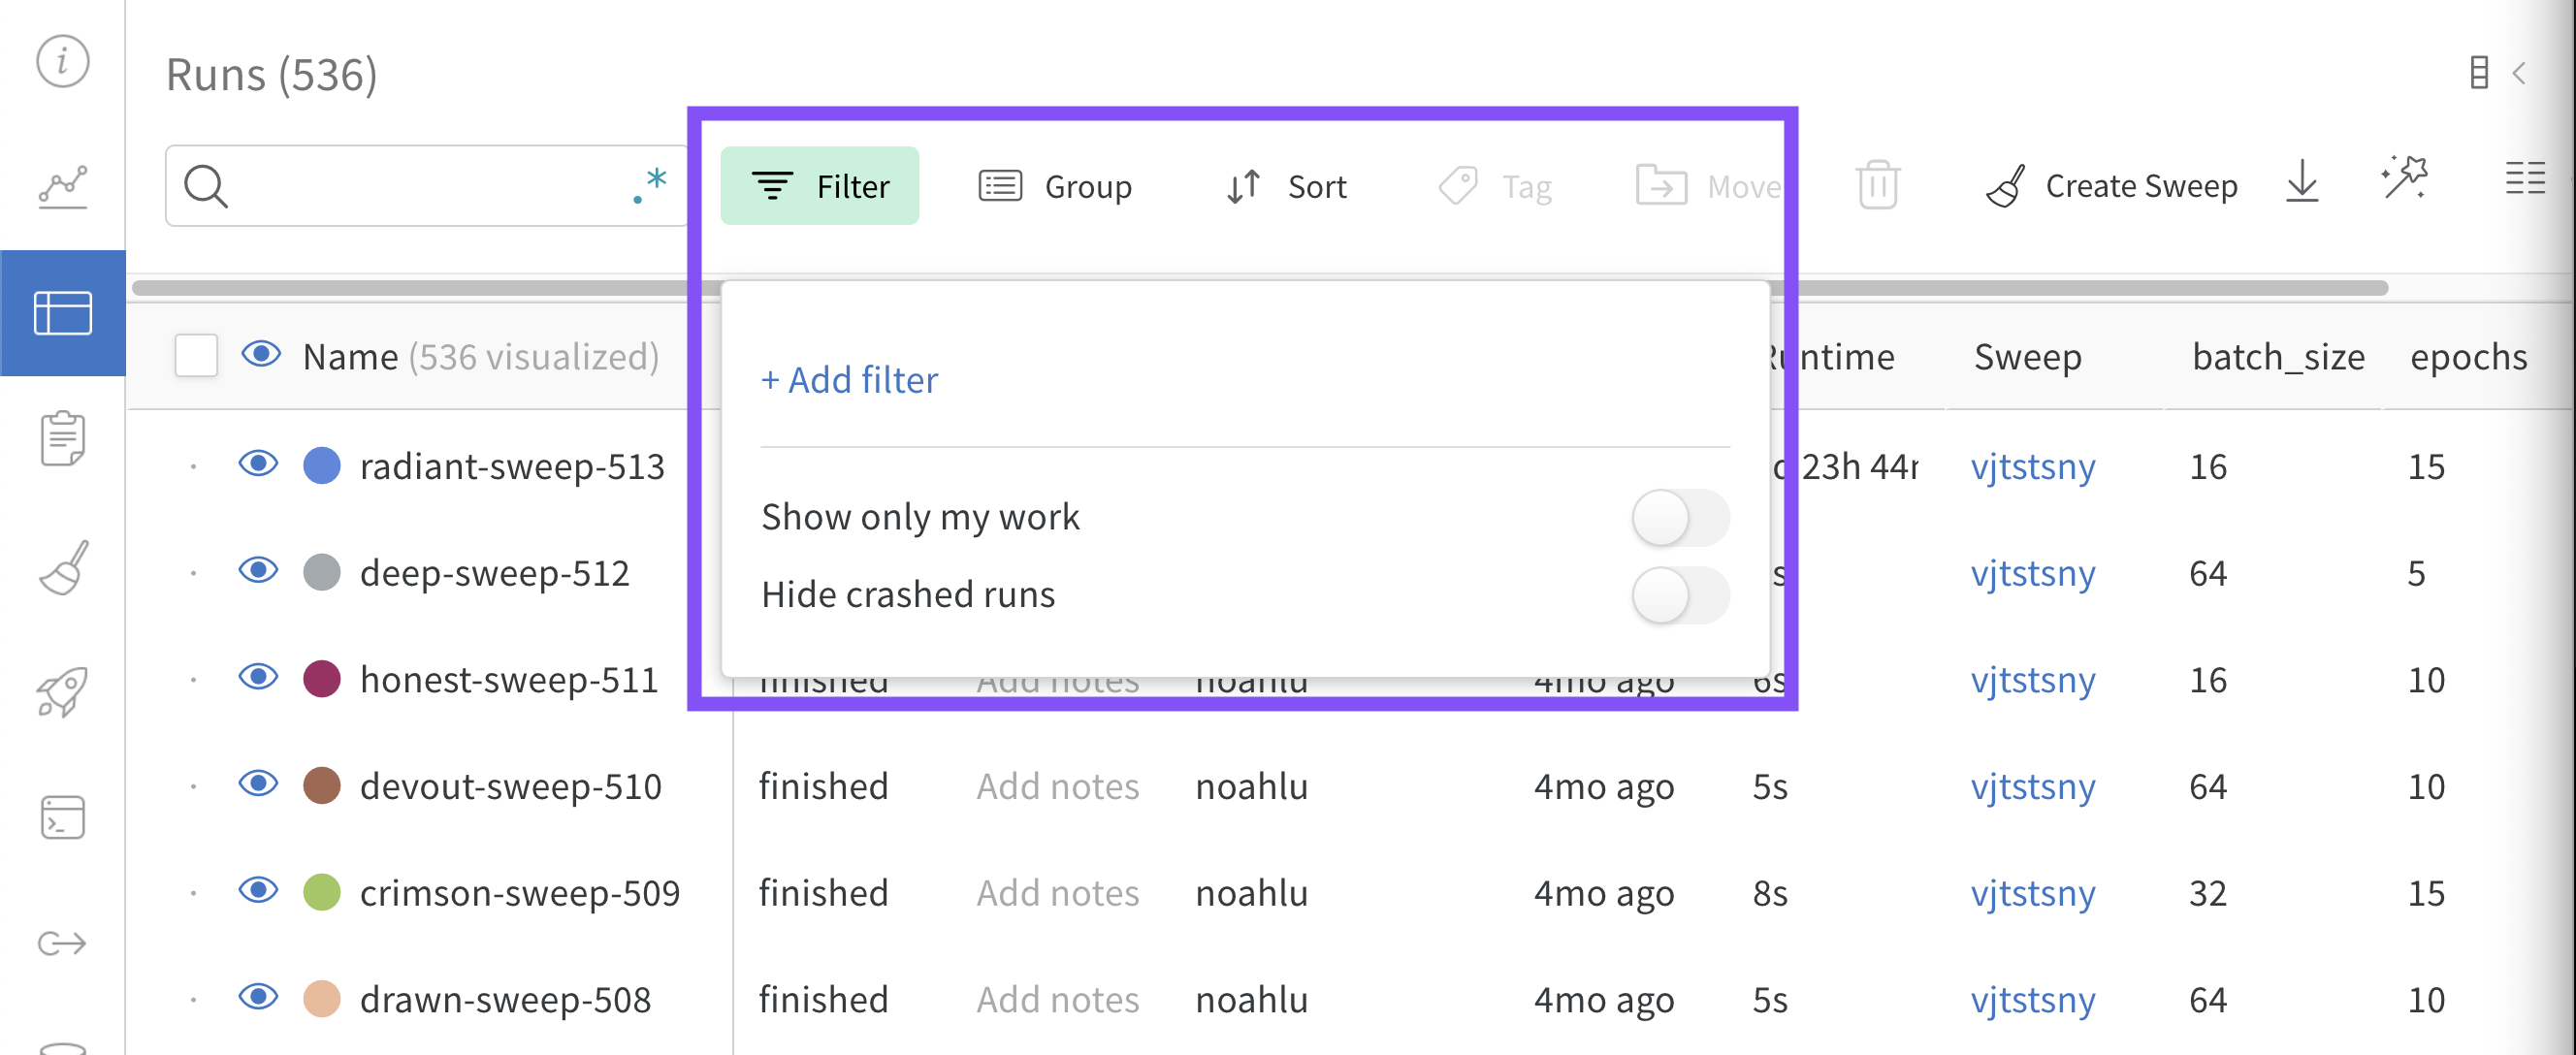
Select Add filter to add one or more filters to your rows. Three dropdown menus will appear. From left to right the filter types are based on: Column name, Operator , and Values
| Column name | Binary relation | Value | |
|---|---|---|---|
| Accepted values | String | =, ≠, ≤, ≥, IN, NOT IN, | Integer, float, string, timestamp, null |
The expression editor shows a list of options for each term using autocomplete on column names and logical predicate structure. You can connect multiple logical predicates into one expression using "and" or "or" (and sometimes parentheses).
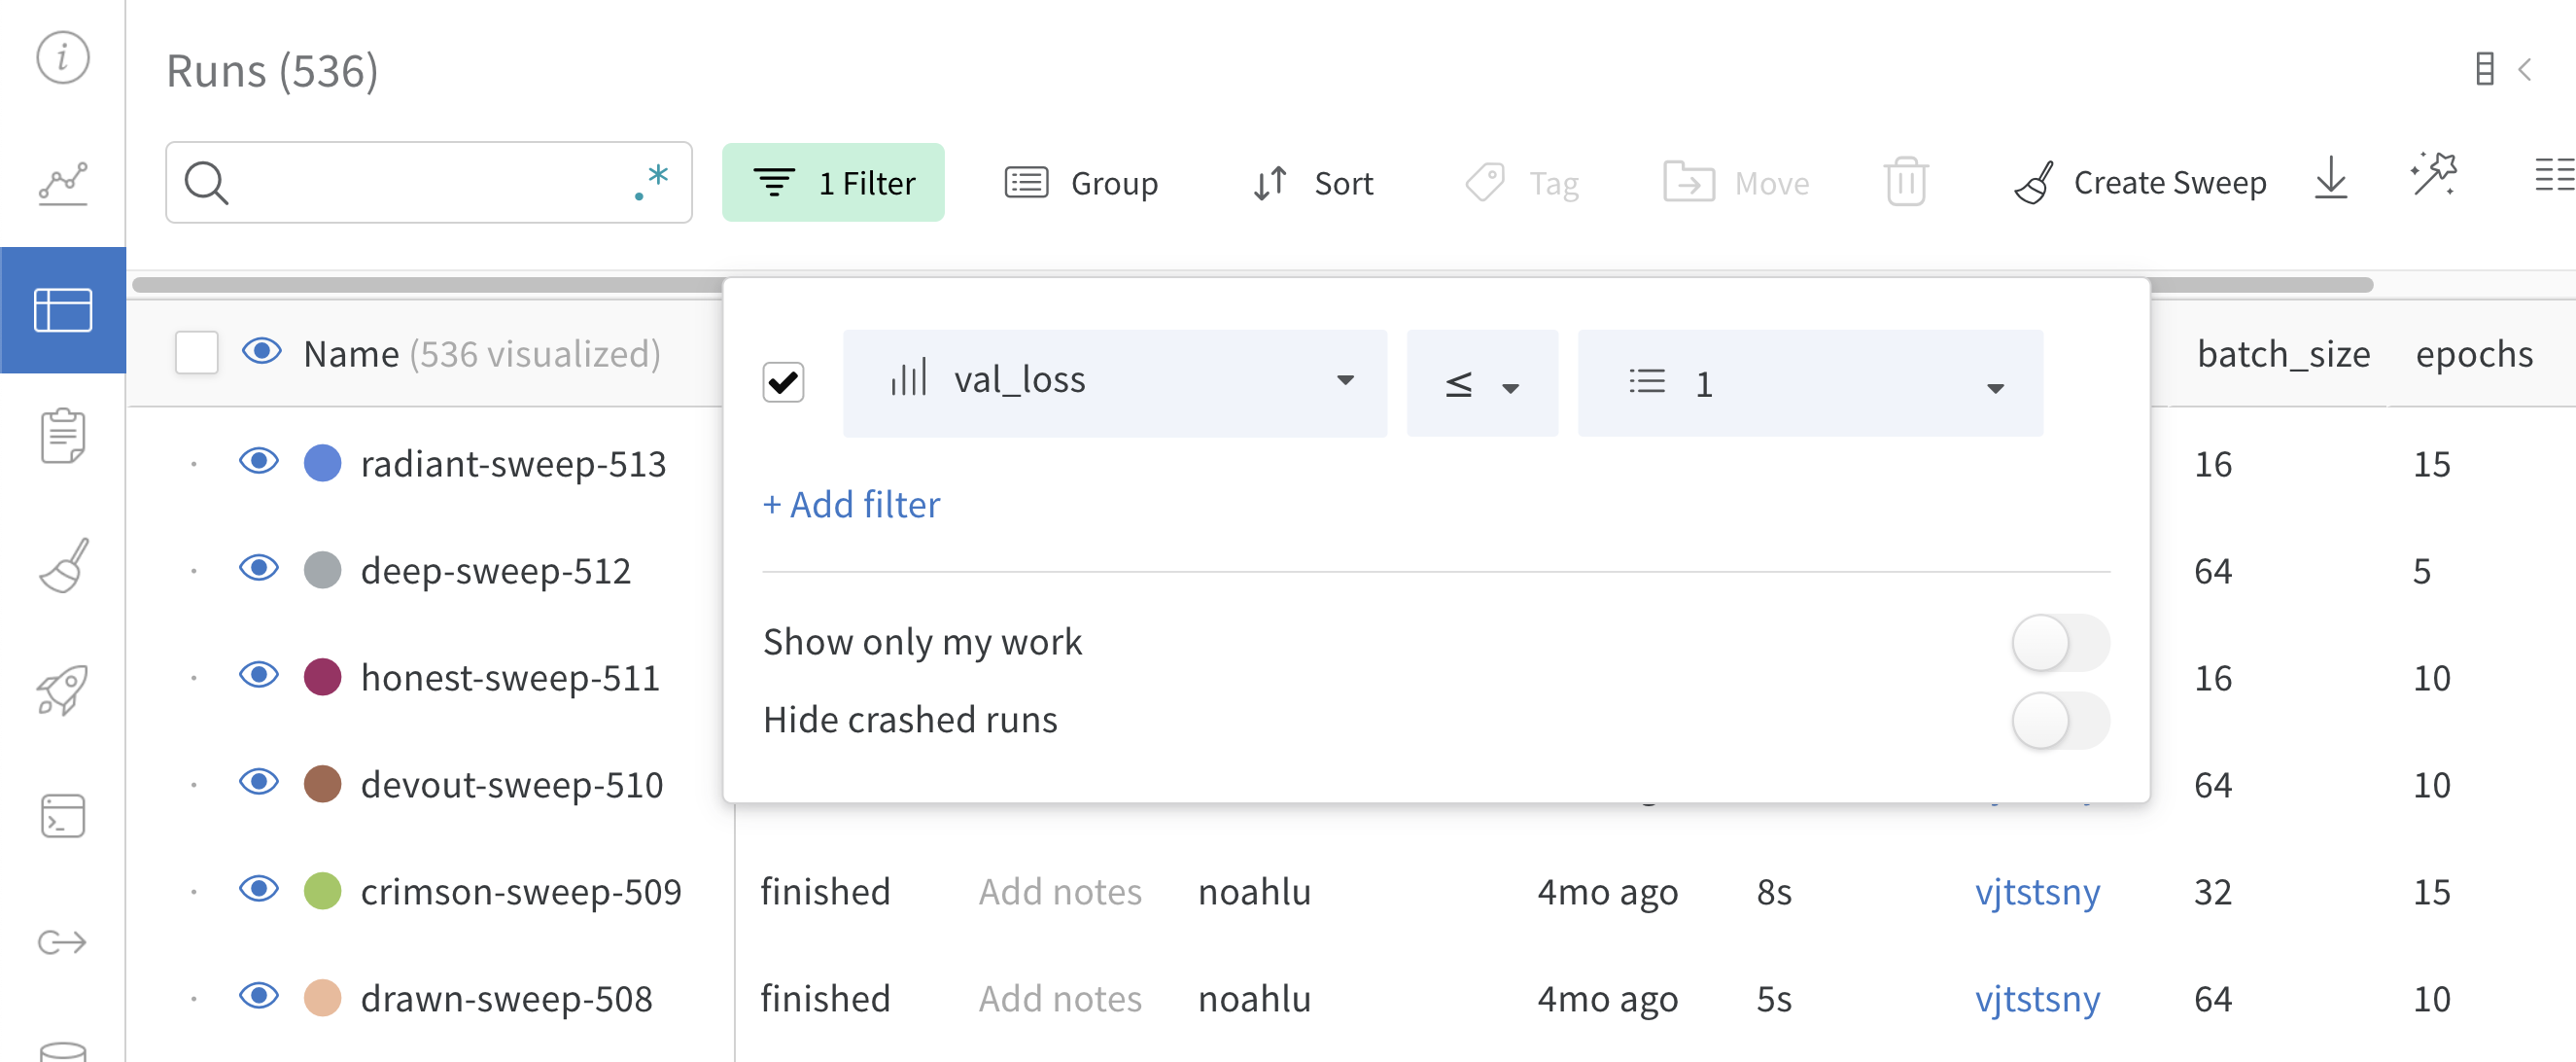 The preceding image shows a filter that is based on the
 val_loss column. The filter shows runs with a validation loss less than or equal to 1.
Group all rows by the value in a particular column with the Group by button in a column header.
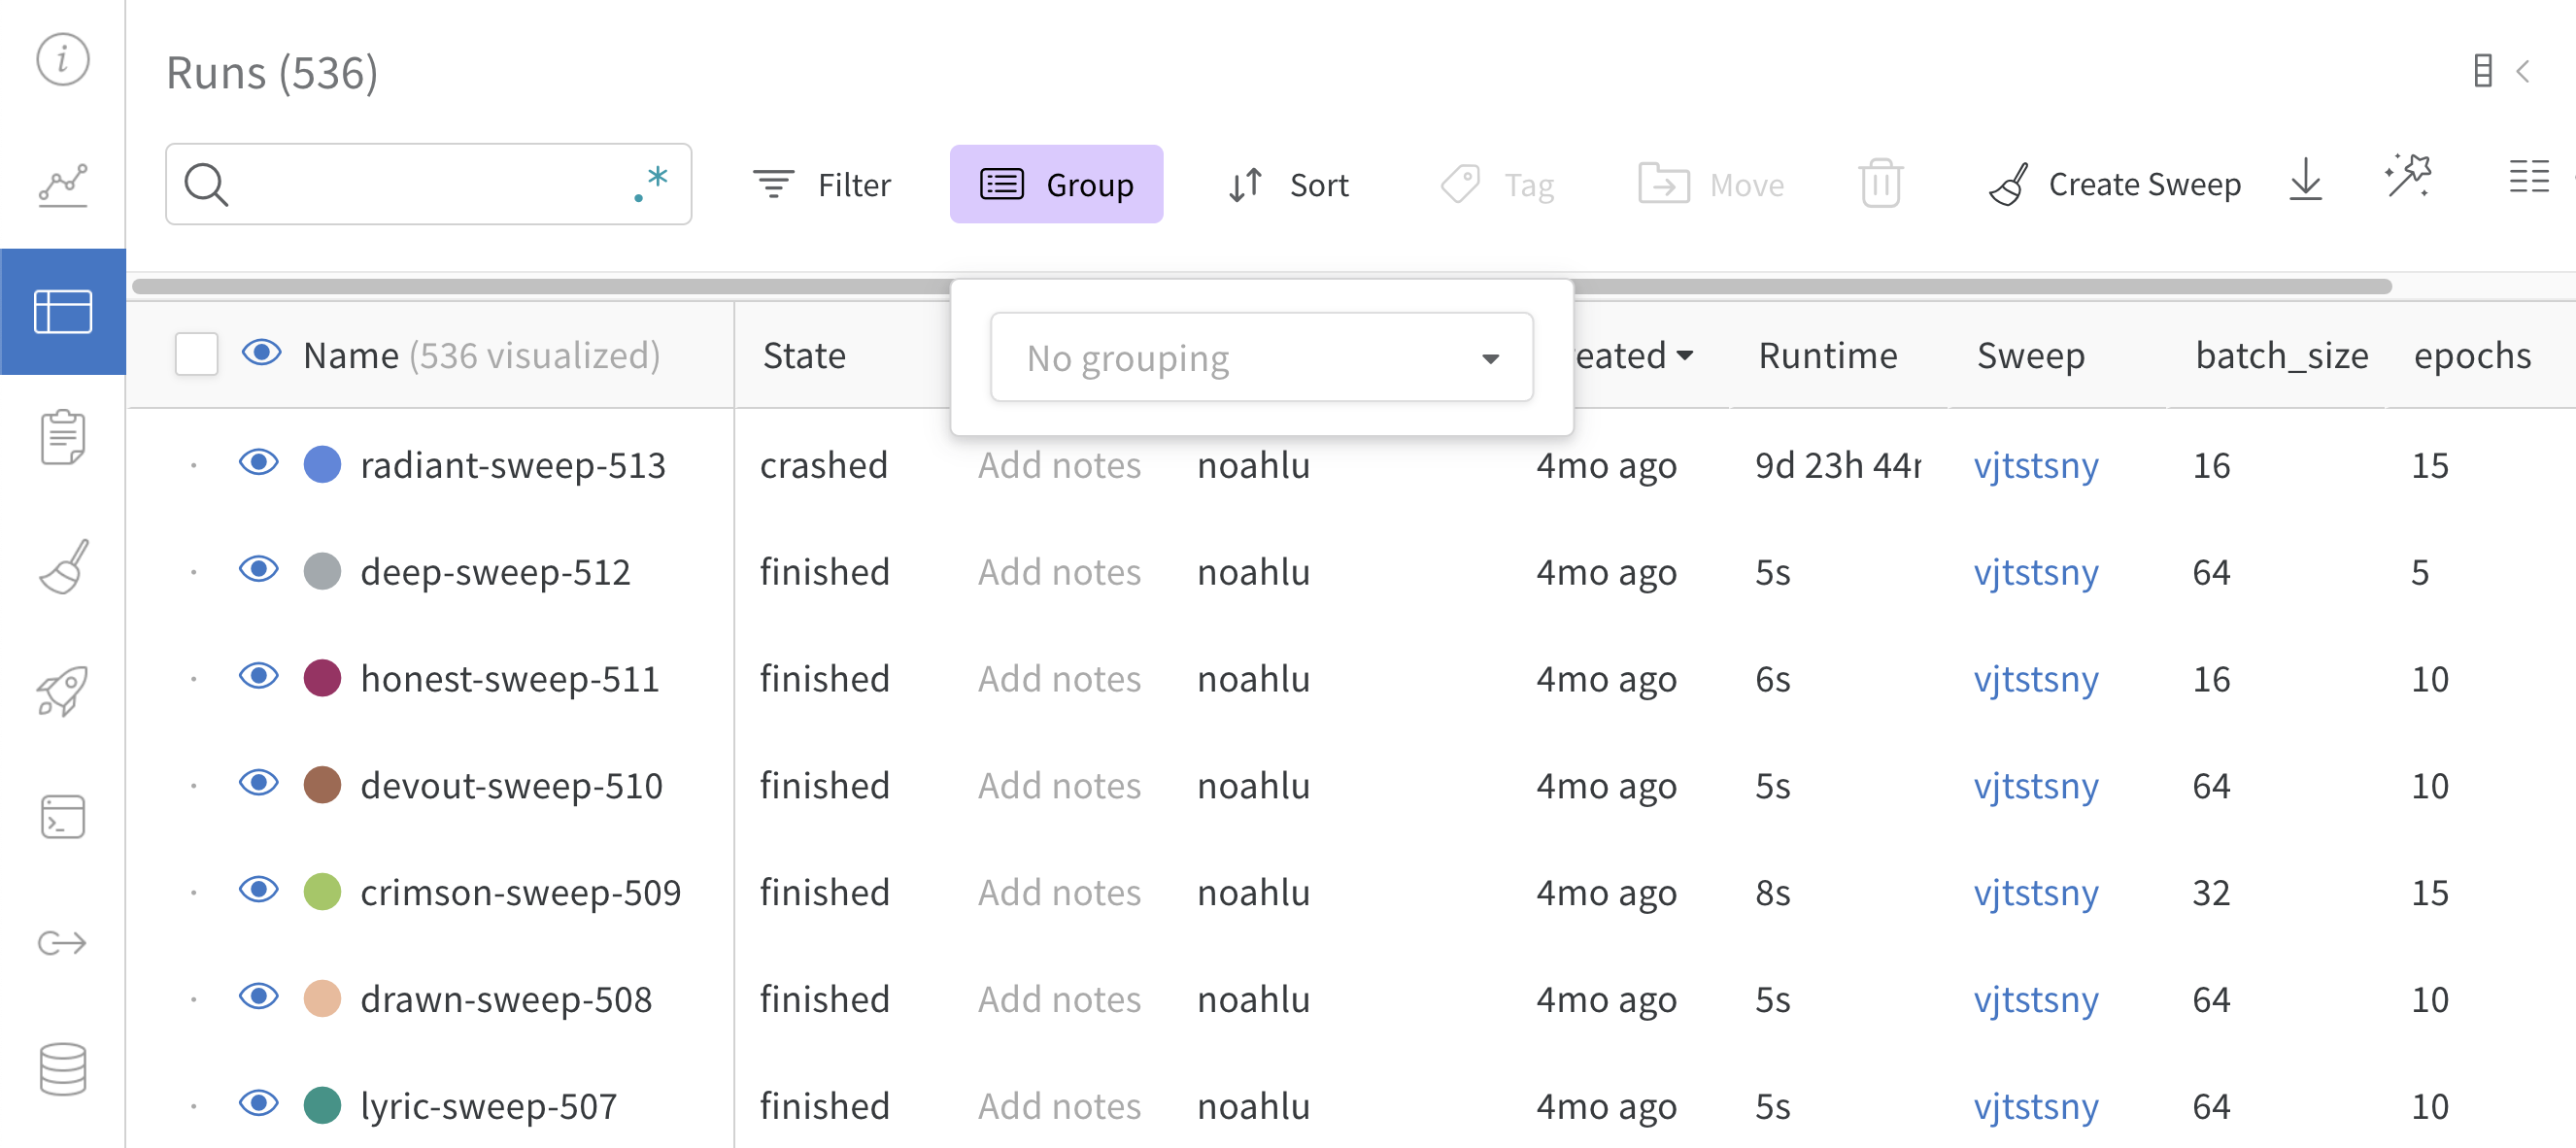
By default, this turns other numeric columns into histograms showing the distribution of values for that column across the group. Grouping is helpful for understanding higher-level patterns in your data.
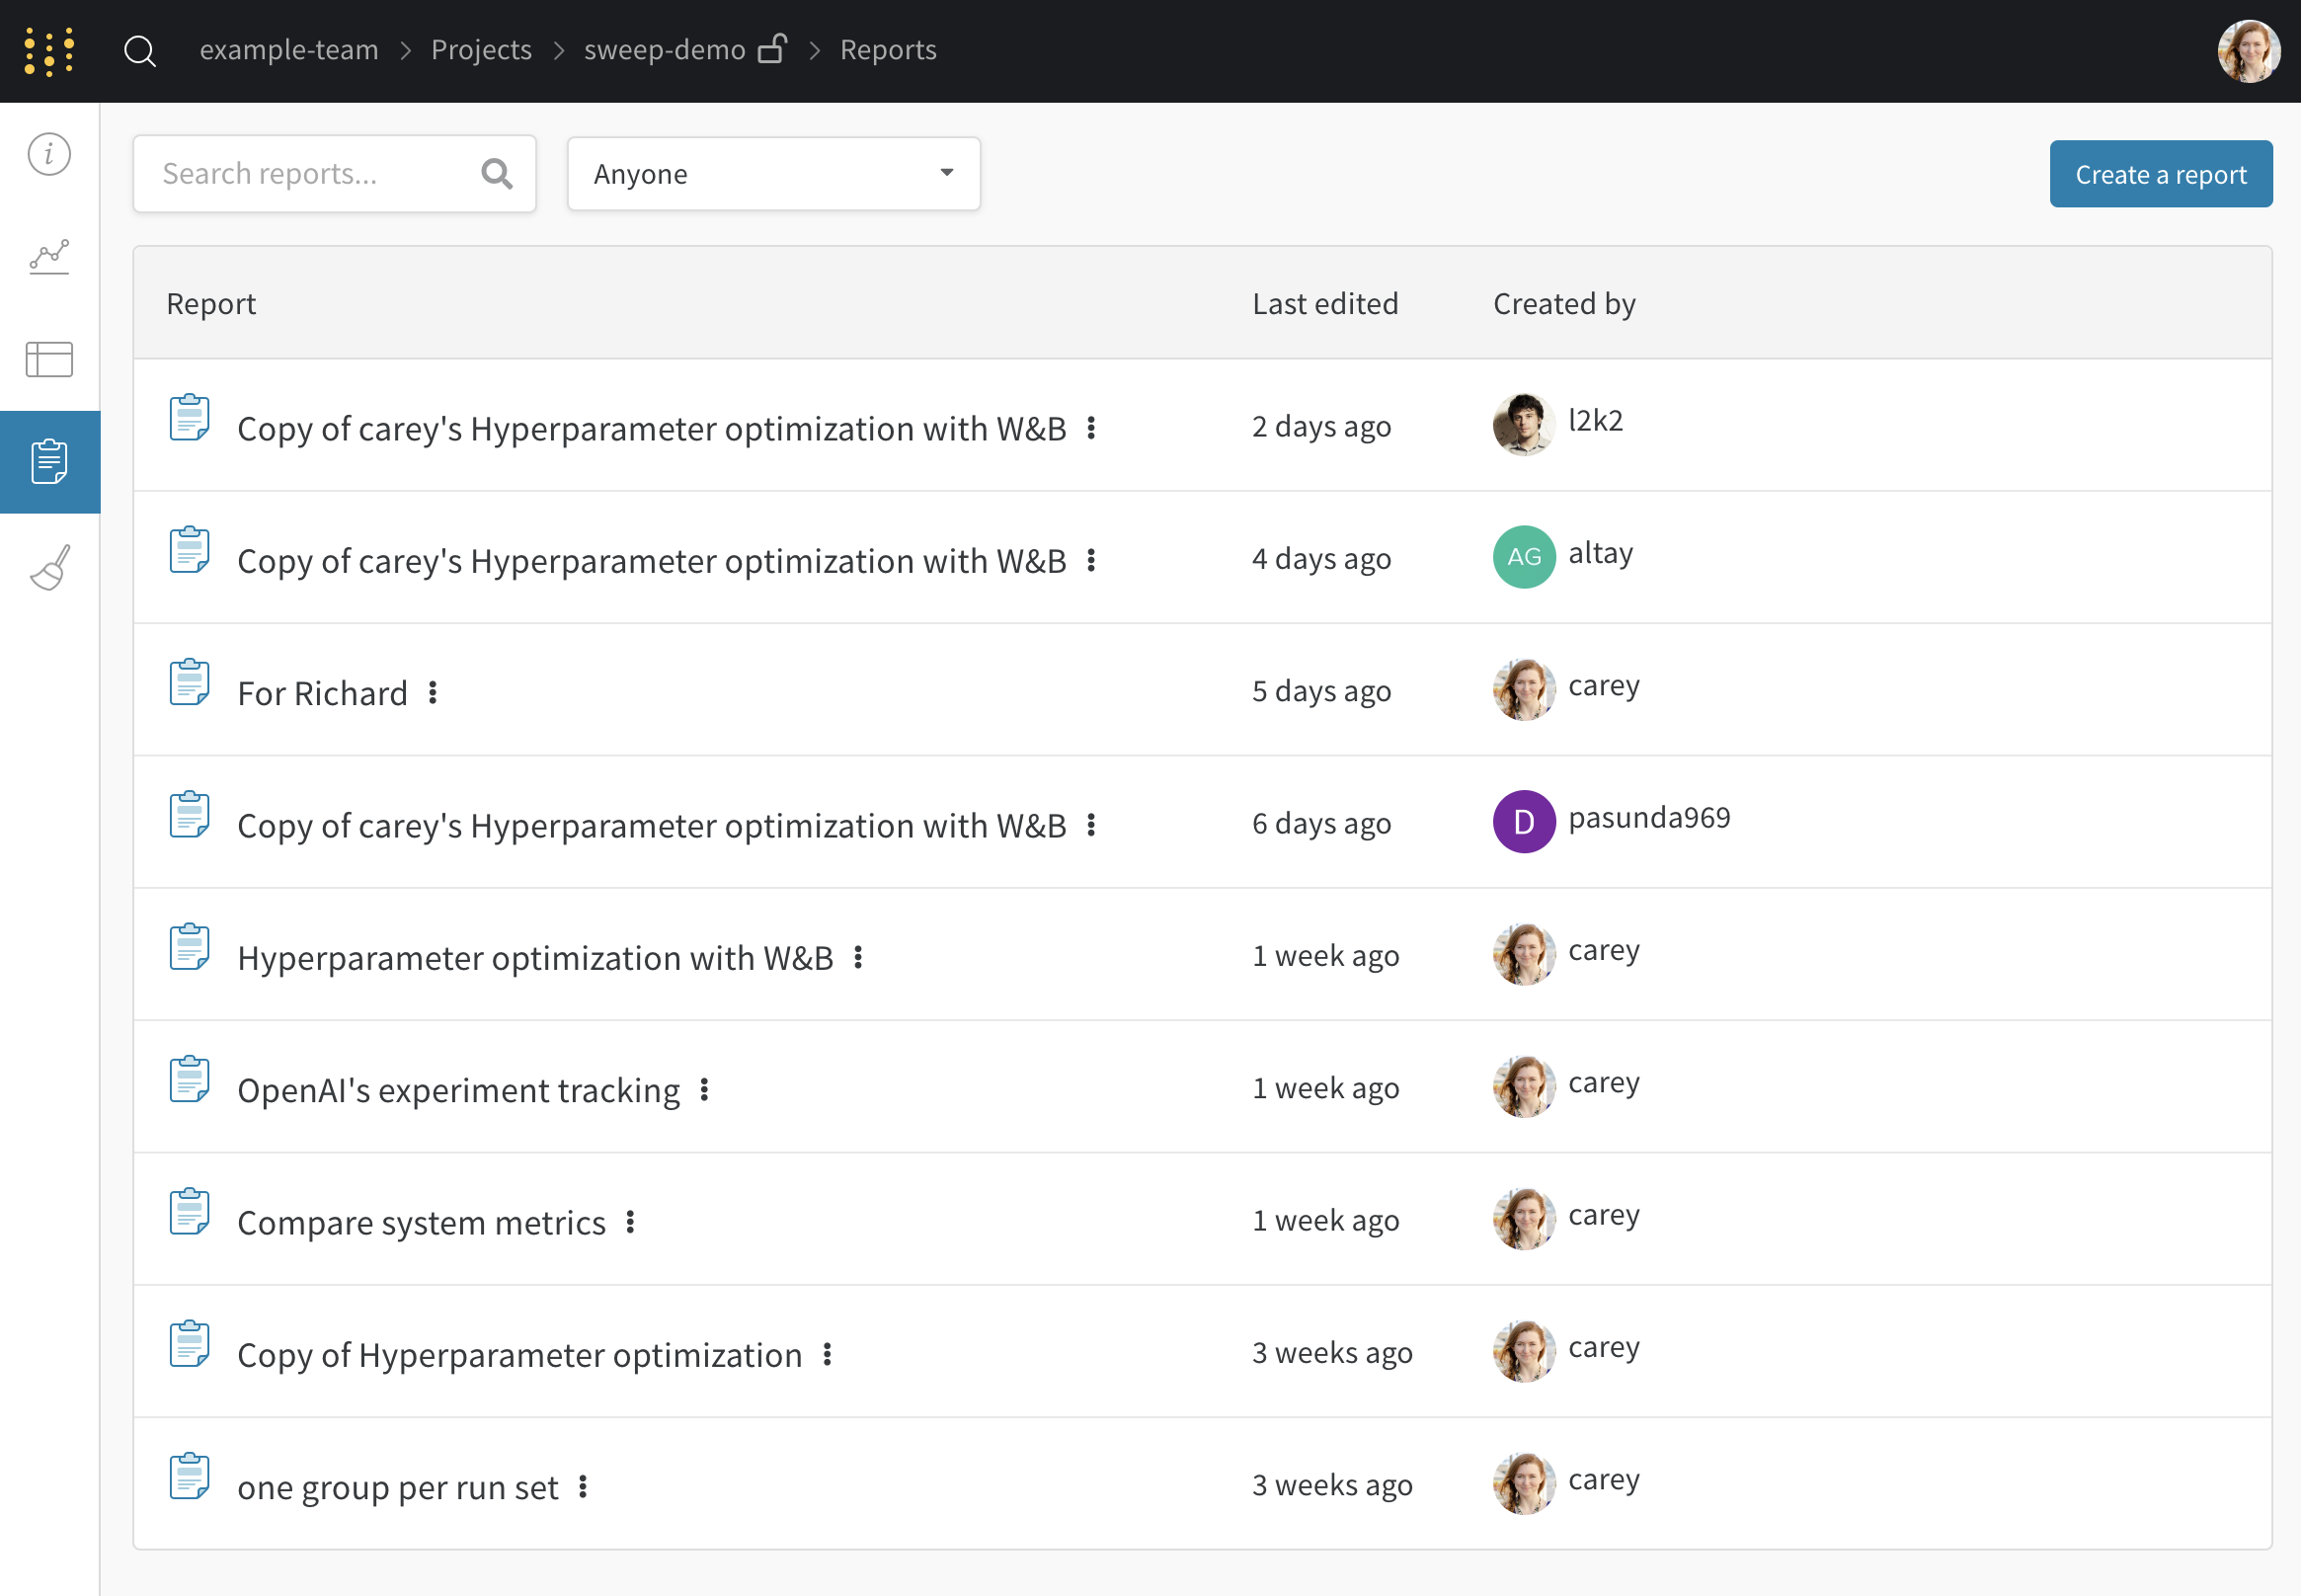
Reports Tab
See all the snapshots of results in one place, and share findings with your team.
Sweeps Tab
Start a new sweep from your project.

Artifacts Tab
View all the artifacts associated with a project, from training datasets and fine-tuned models to tables of metrics and media.
Overview panel
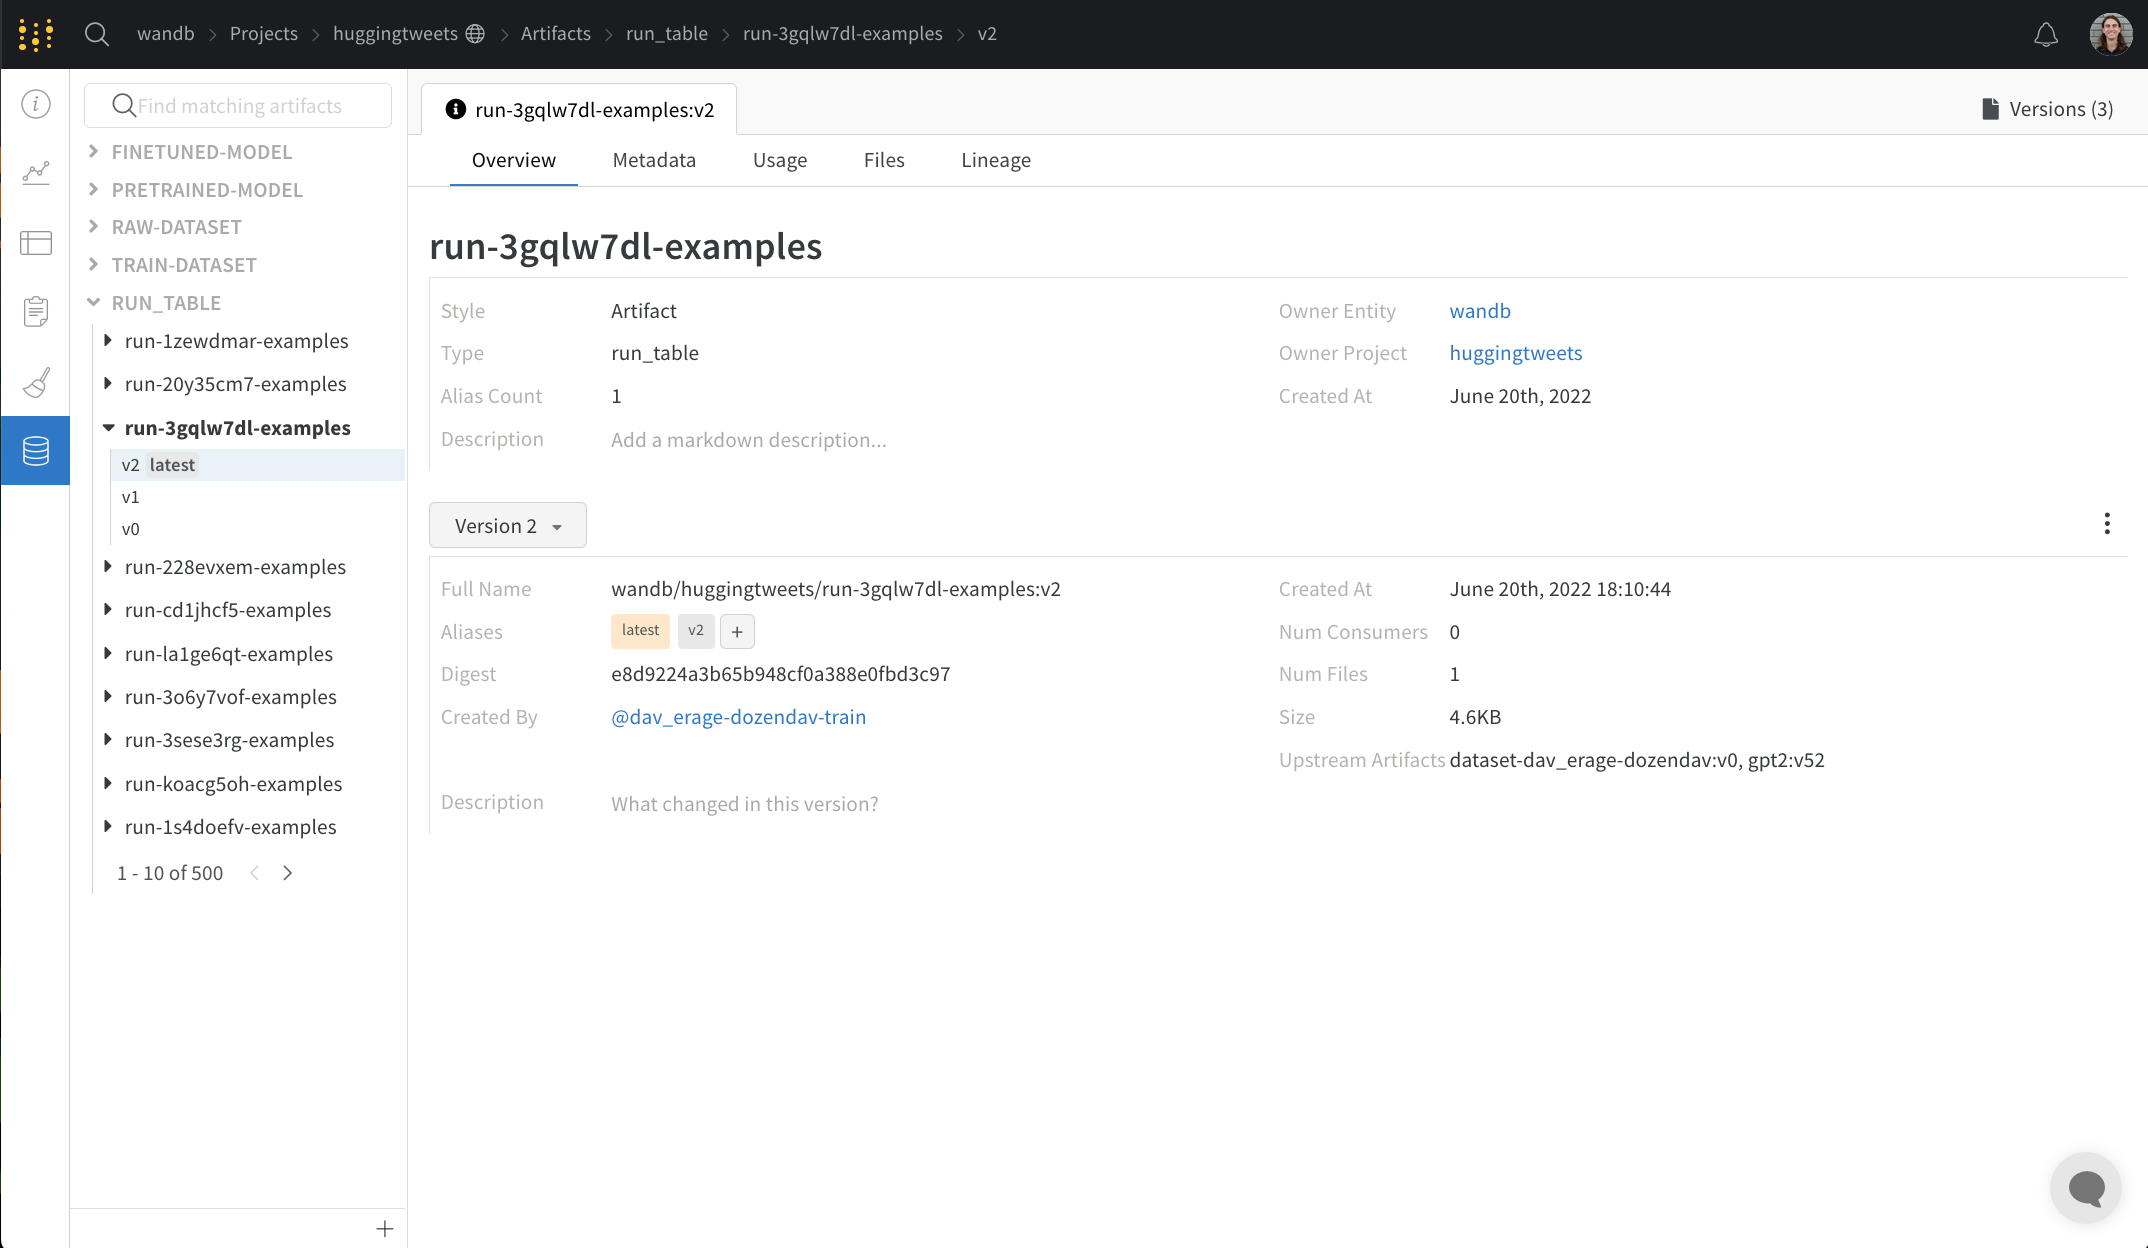
On the overview panel, you'll find a variety of high-level information about the artifact, including its name and version, the hash digest used to detect changes and prevent duplication, the creation date, and any aliases. You can add or remove aliases here, take notes on both the version as well as the artifact as a whole.
Metadata panel
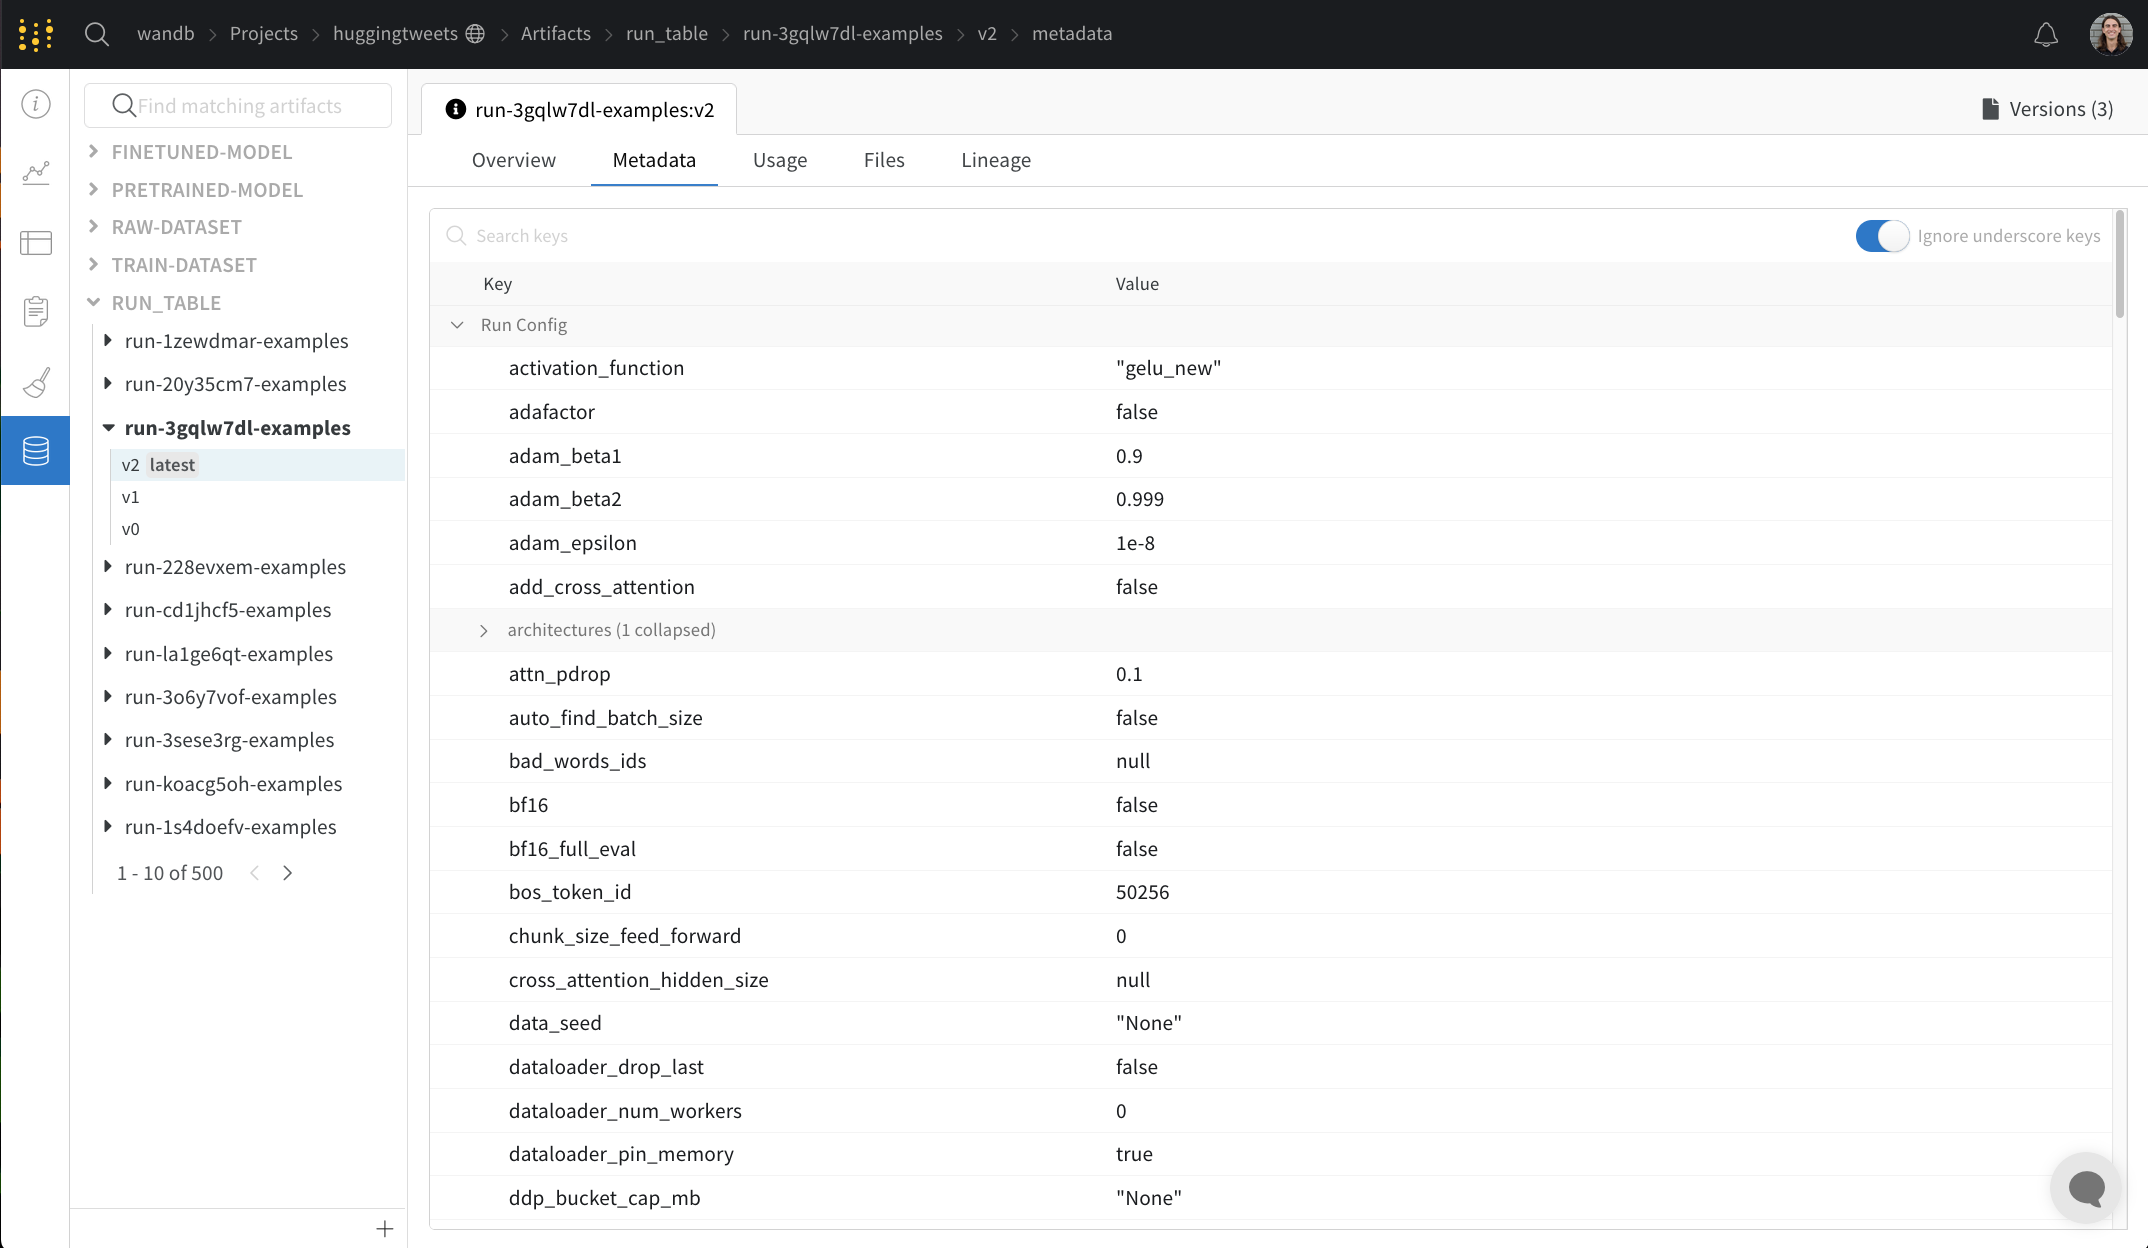
The metadata panel provides access to the artifact's metadata, which is provided when the artifact is constructed. This metadata might include configuration arguments required to reconstruct the artifact, URLs where more information can be found, or metrics produced during the run which logged the artifact. Additionally, you can see the configuration for the run which produced the artifact as well as the history metrics at the time of logging the artifact.
Usage panel
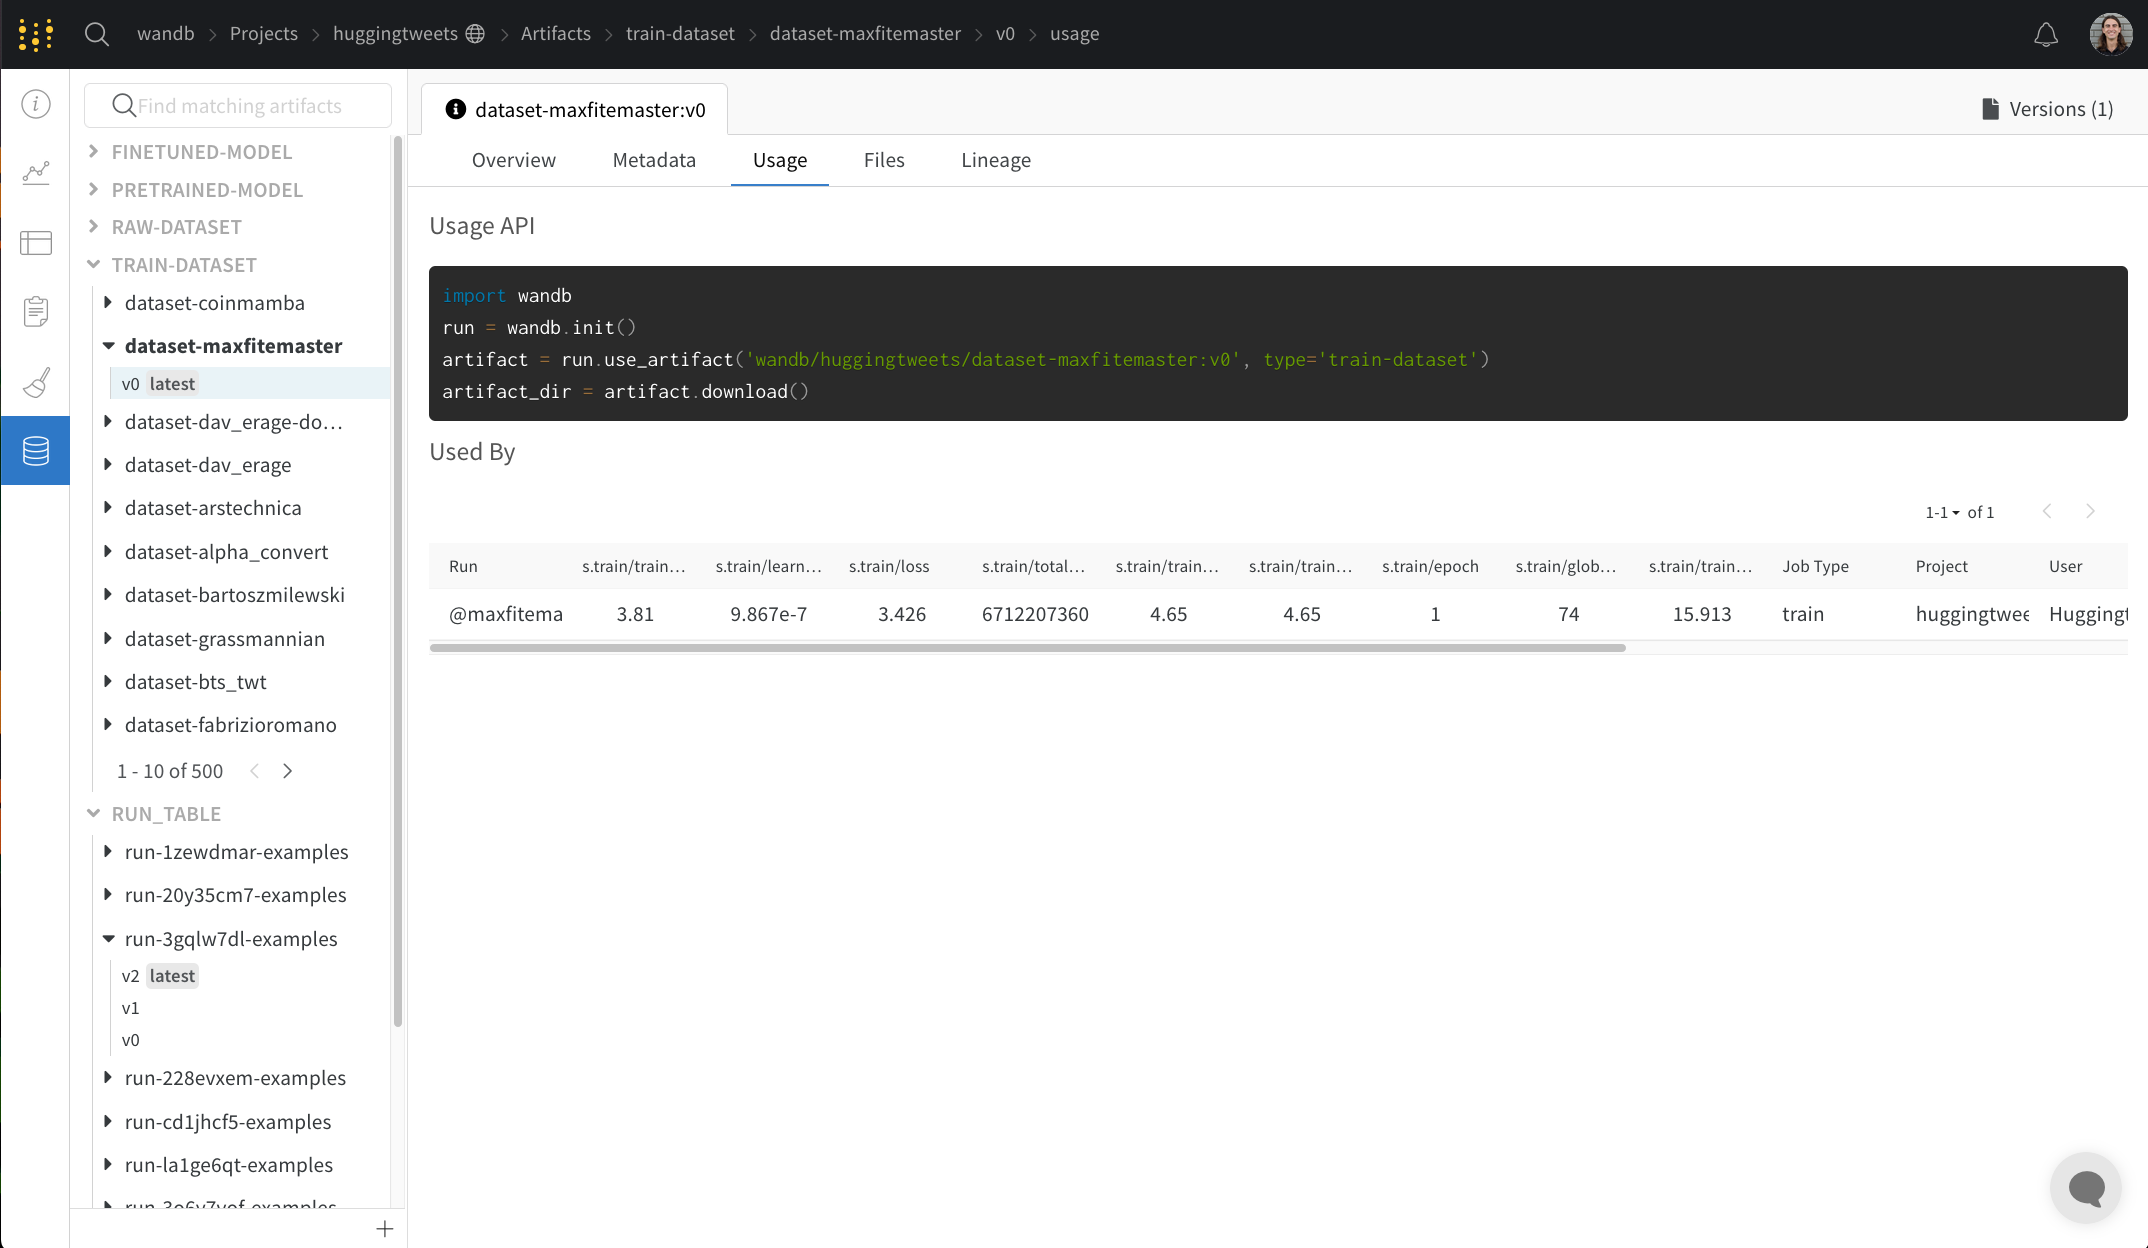
The Usage panel provides a code snippet for downloading the artifact for use outside of the web app, for example on a local machine. This section also indicates and links to the run which output the artifact and any runs which use the artifact as an input.
Files panel
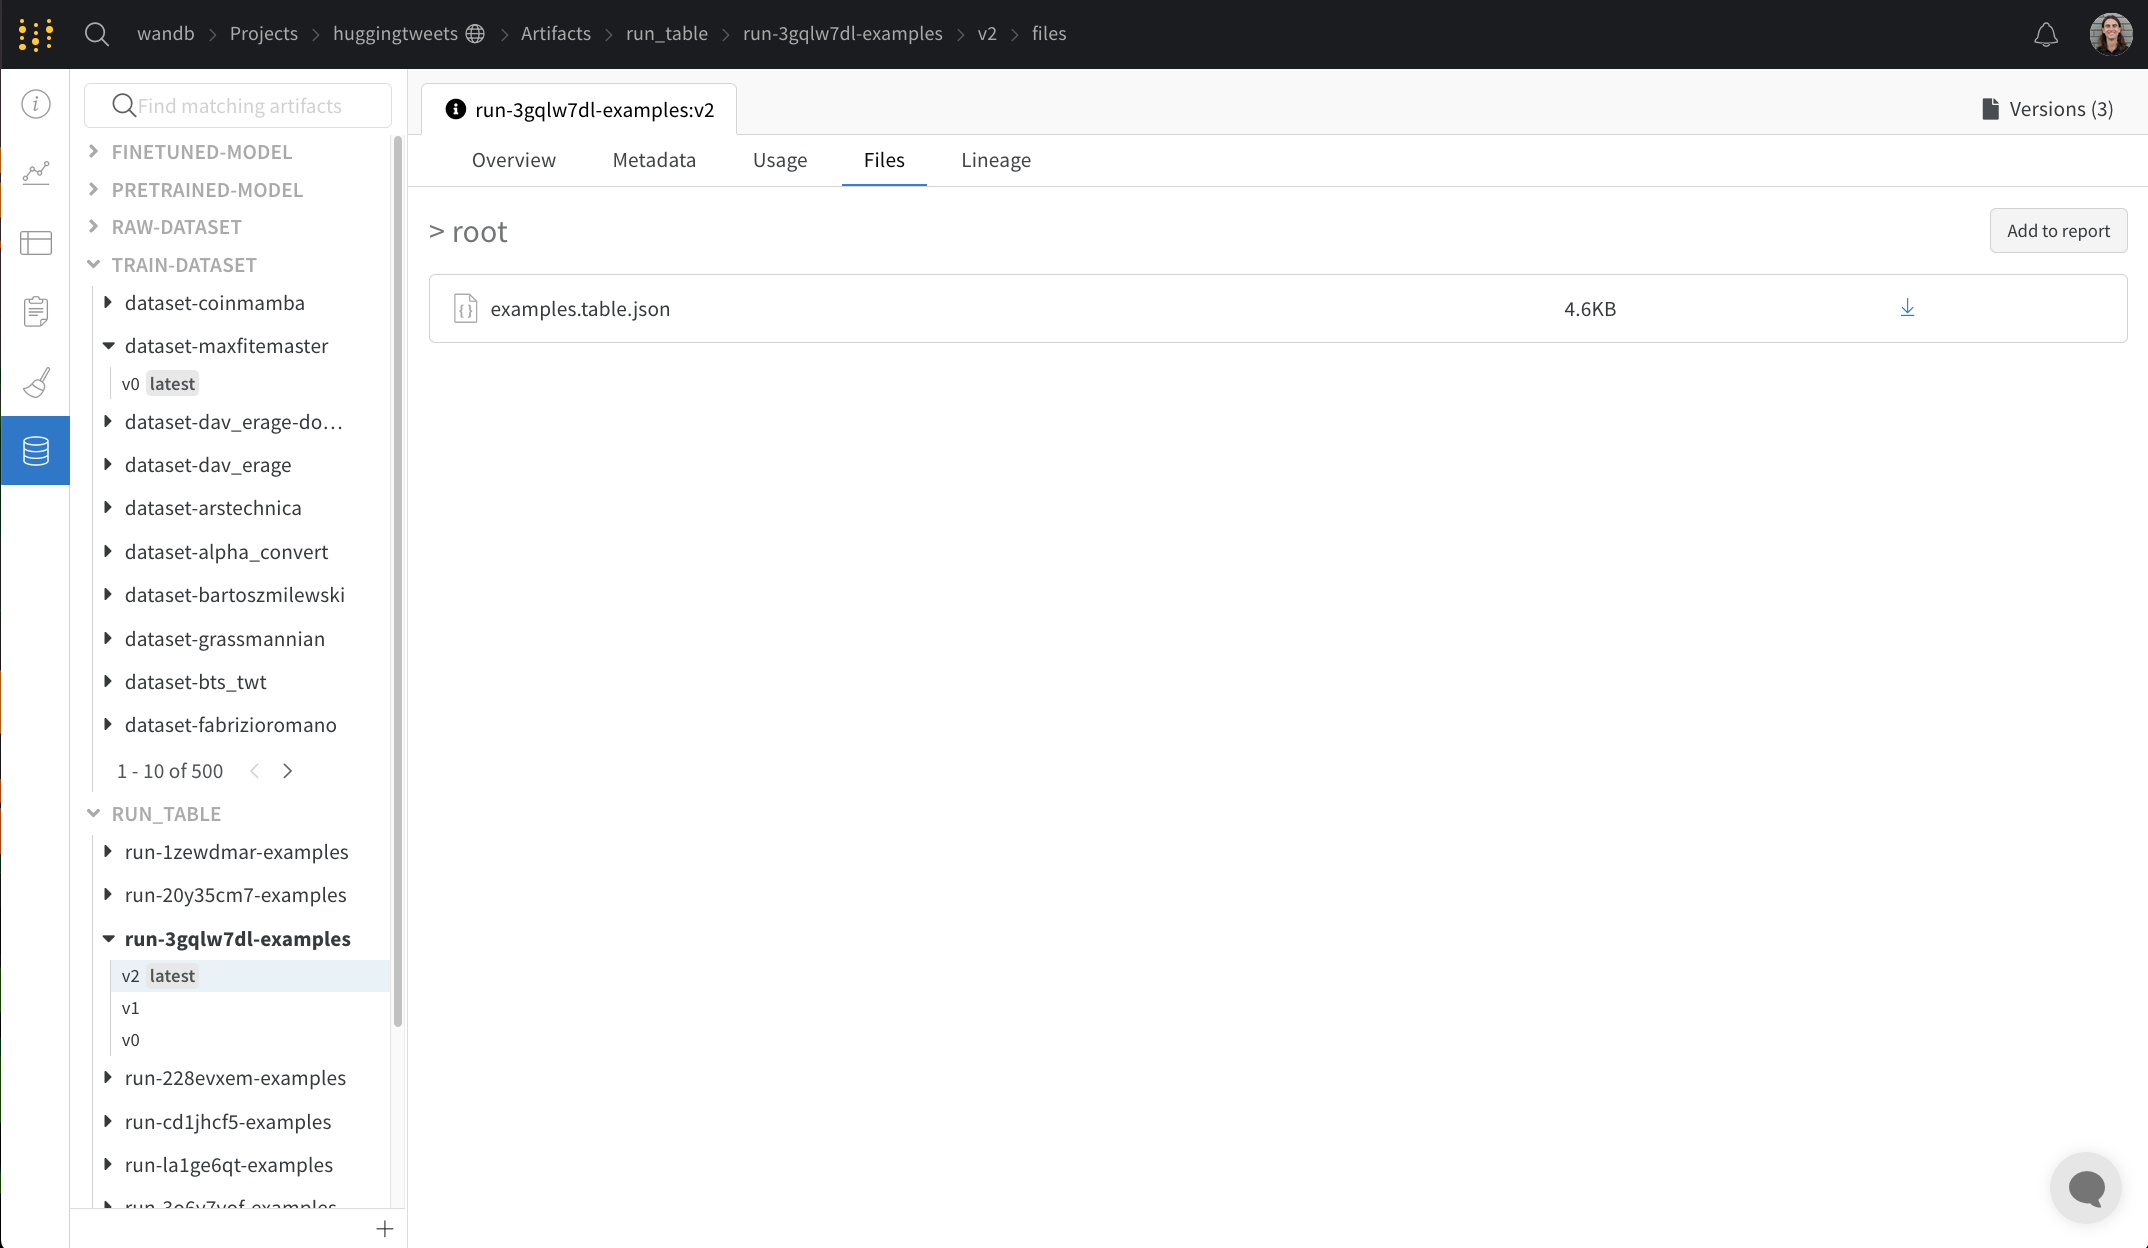
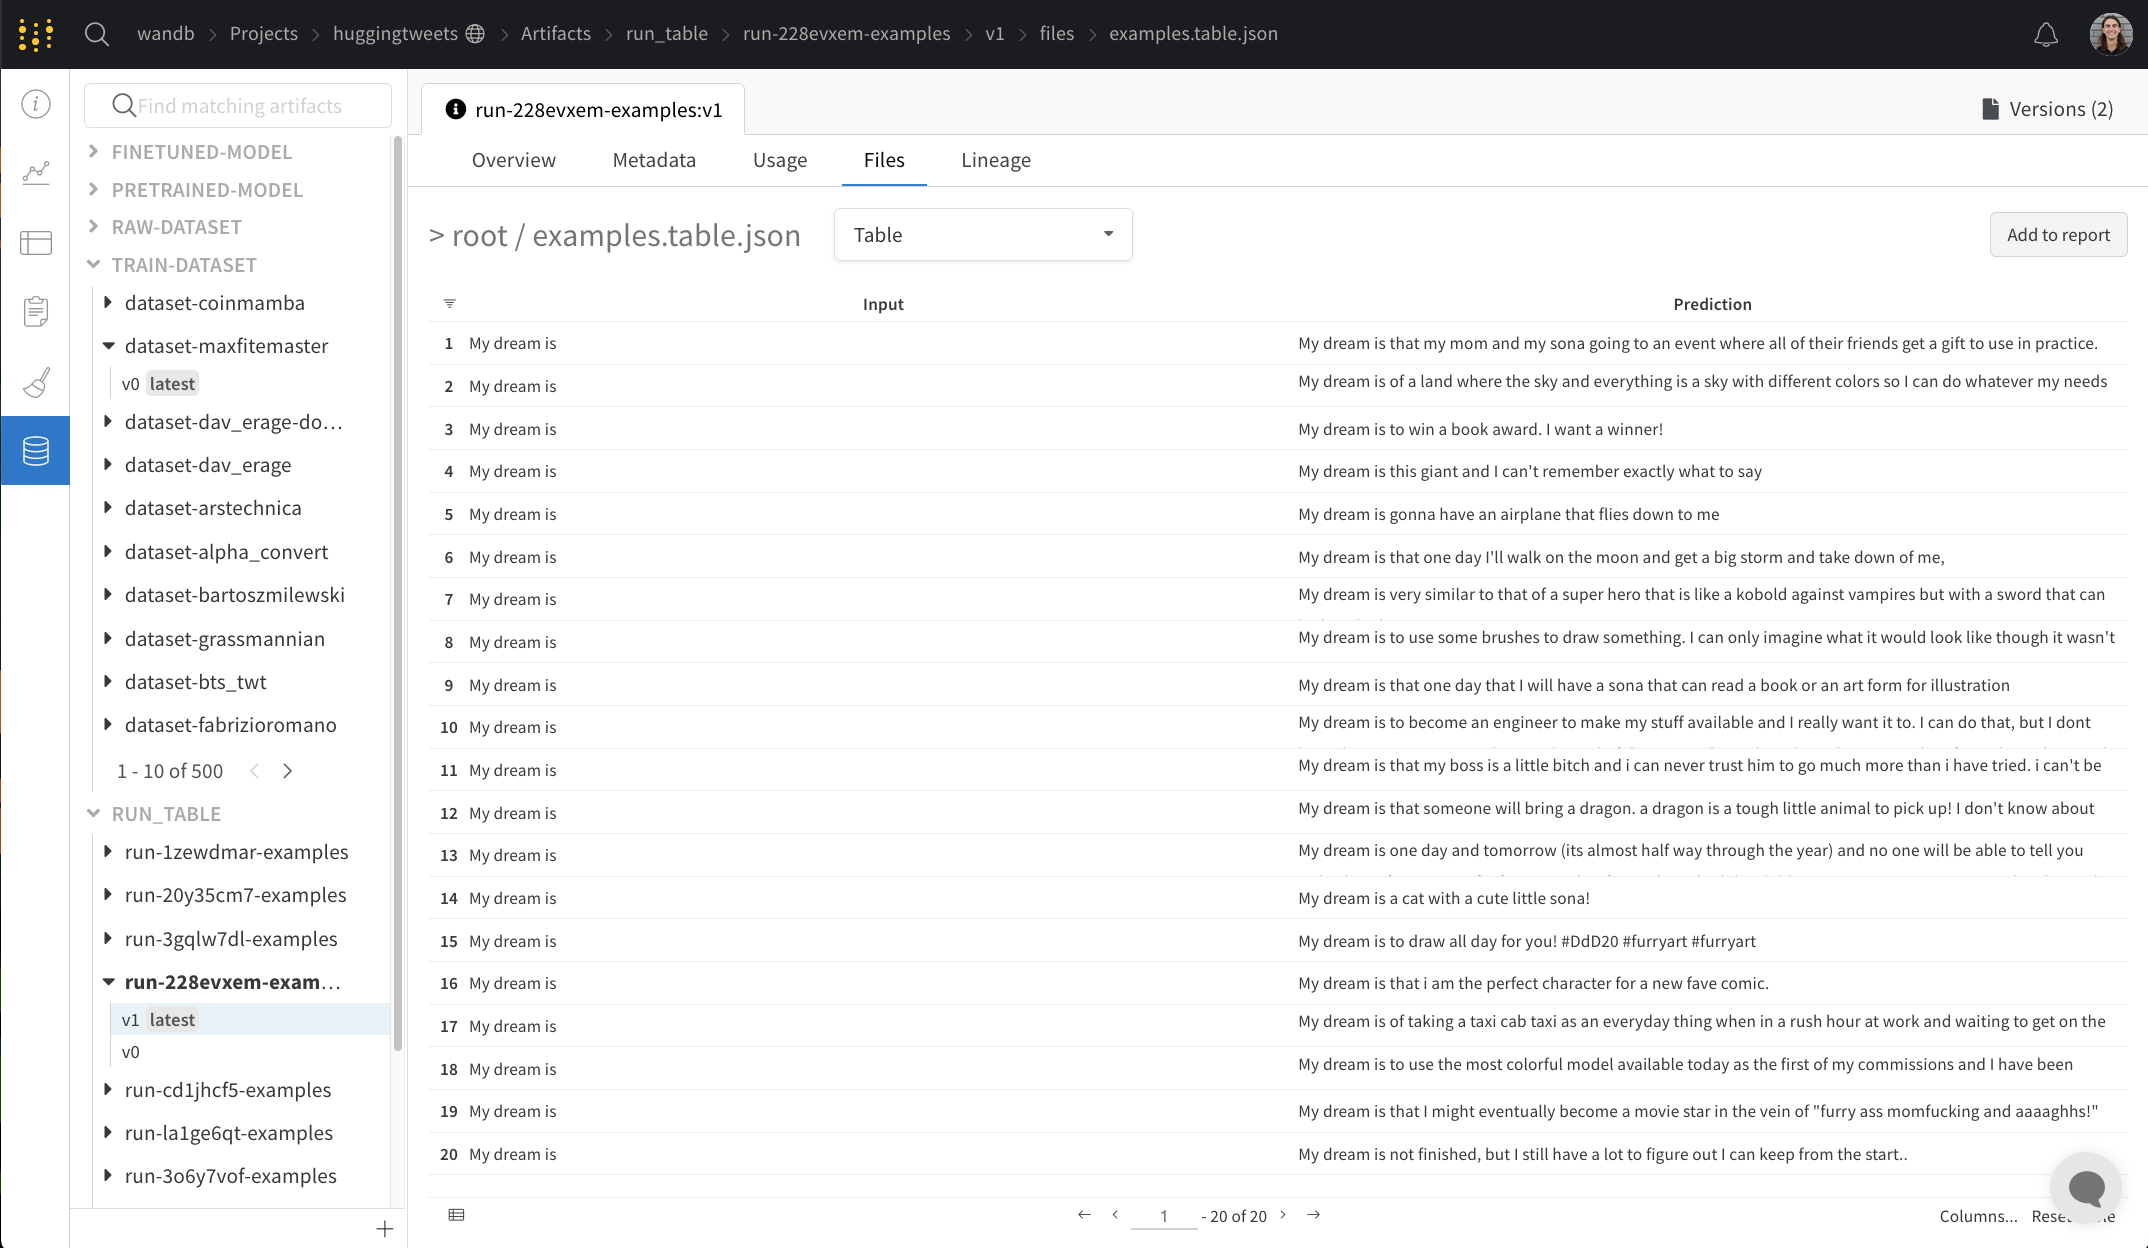
The files panel lists the files and folders associated with the artifact. You can navigate through this file tree and view the contents directly in the W&B web app.
Tables associated with artifacts are particularly rich and interactive in this context. Learn more about using Tables with Artifacts here.
Lineage panel
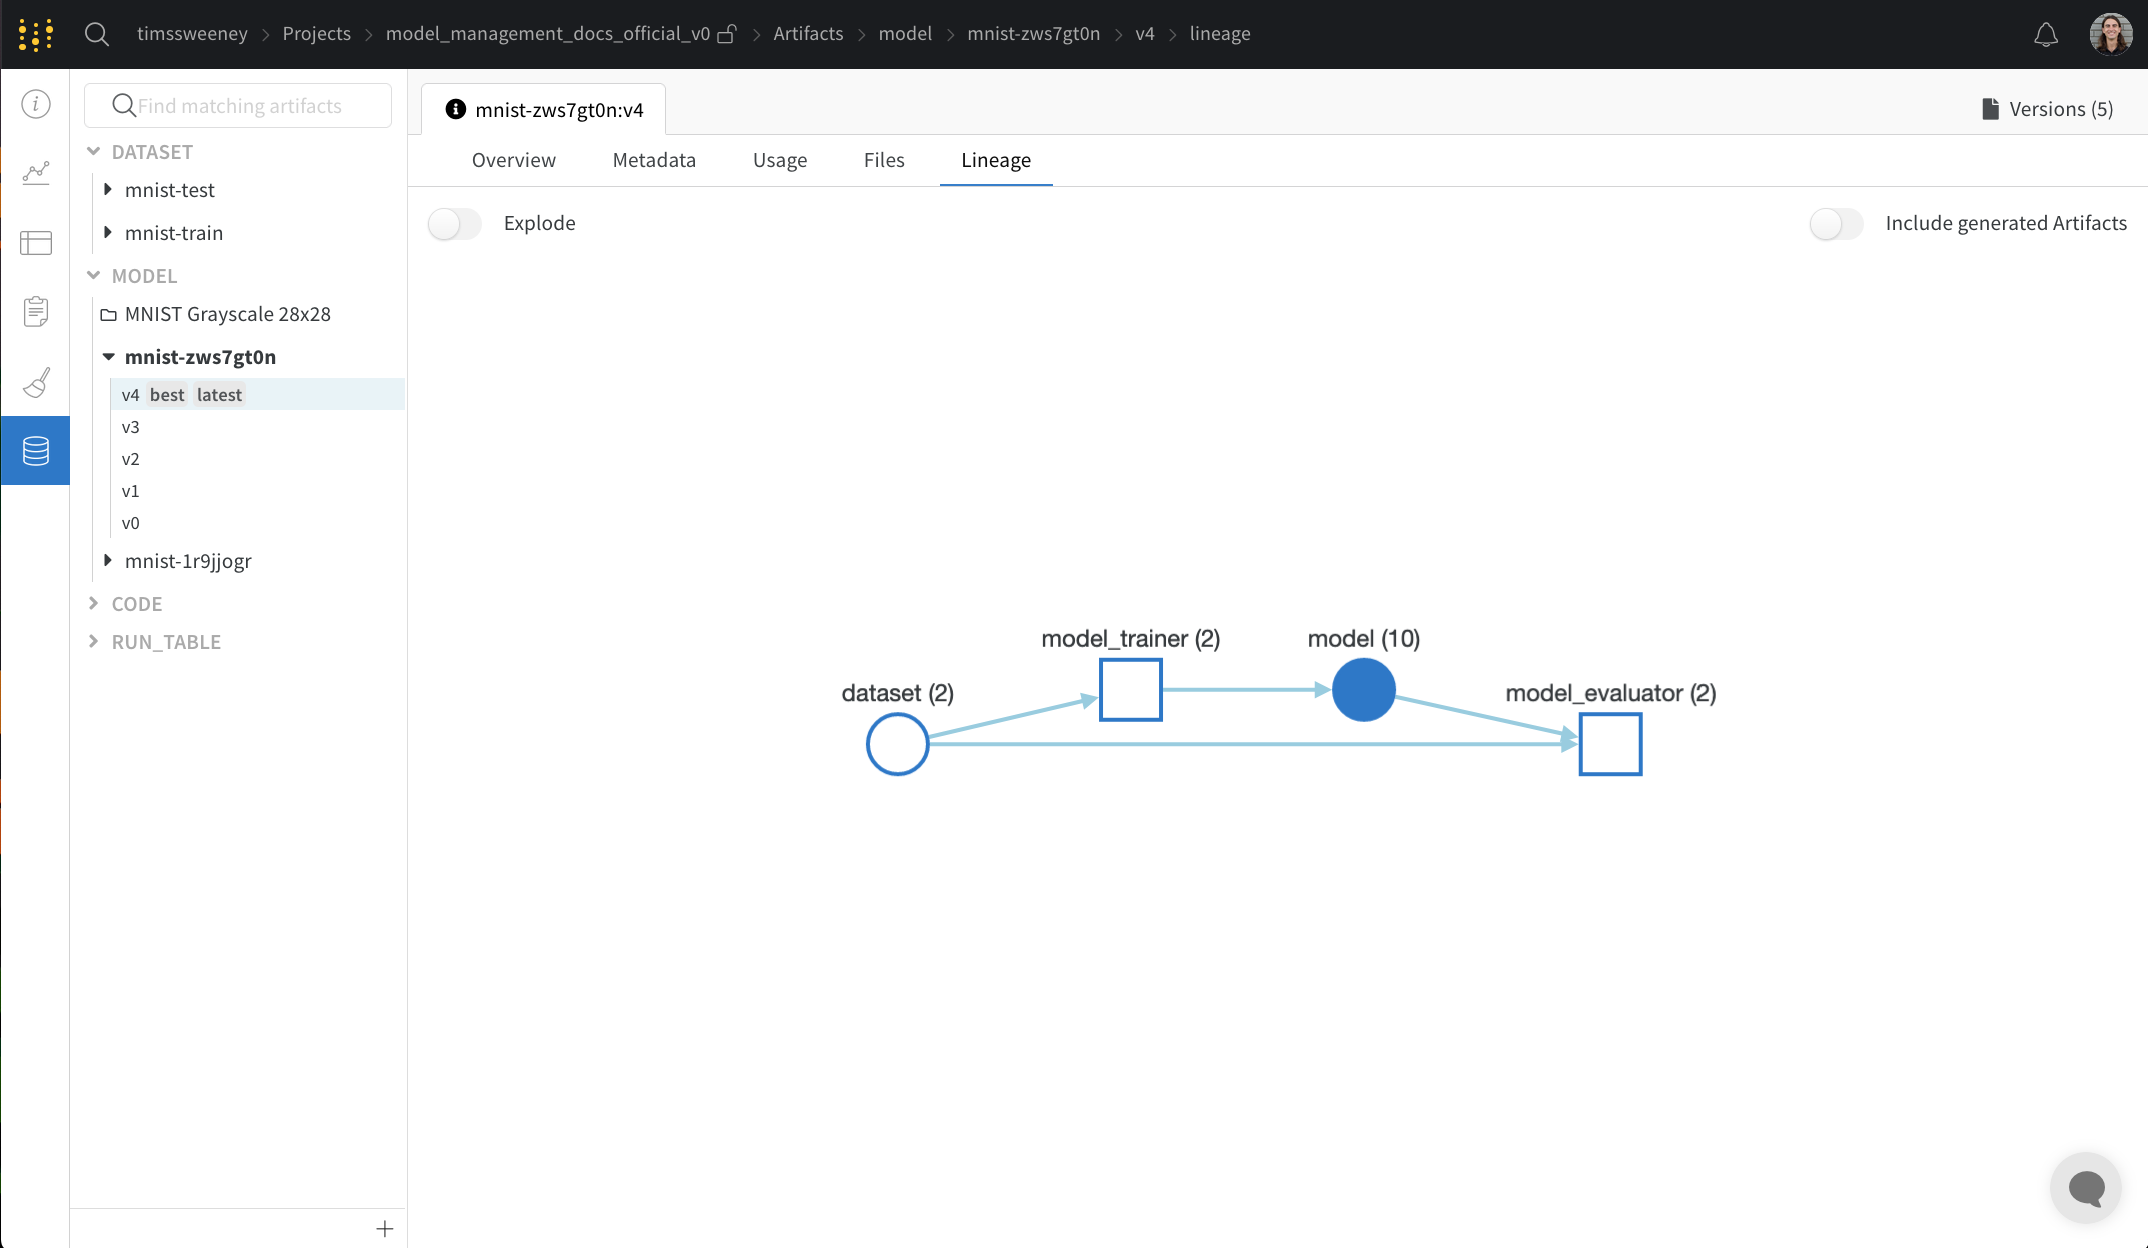
The lineage panel provides a view of all of the artifacts associated with a project and the runs that connect them to each other. It shows run types as blocks and artifacts as circles, with arrows to indicate when a run of a given type consumes or produces an artifact of a given type. The type of the particular artifact selected in the left-hand column is highlighted.
Click the Explode toggle to view all of the individual artifact versions and the specific runs that connect them.
Action History Audit tab
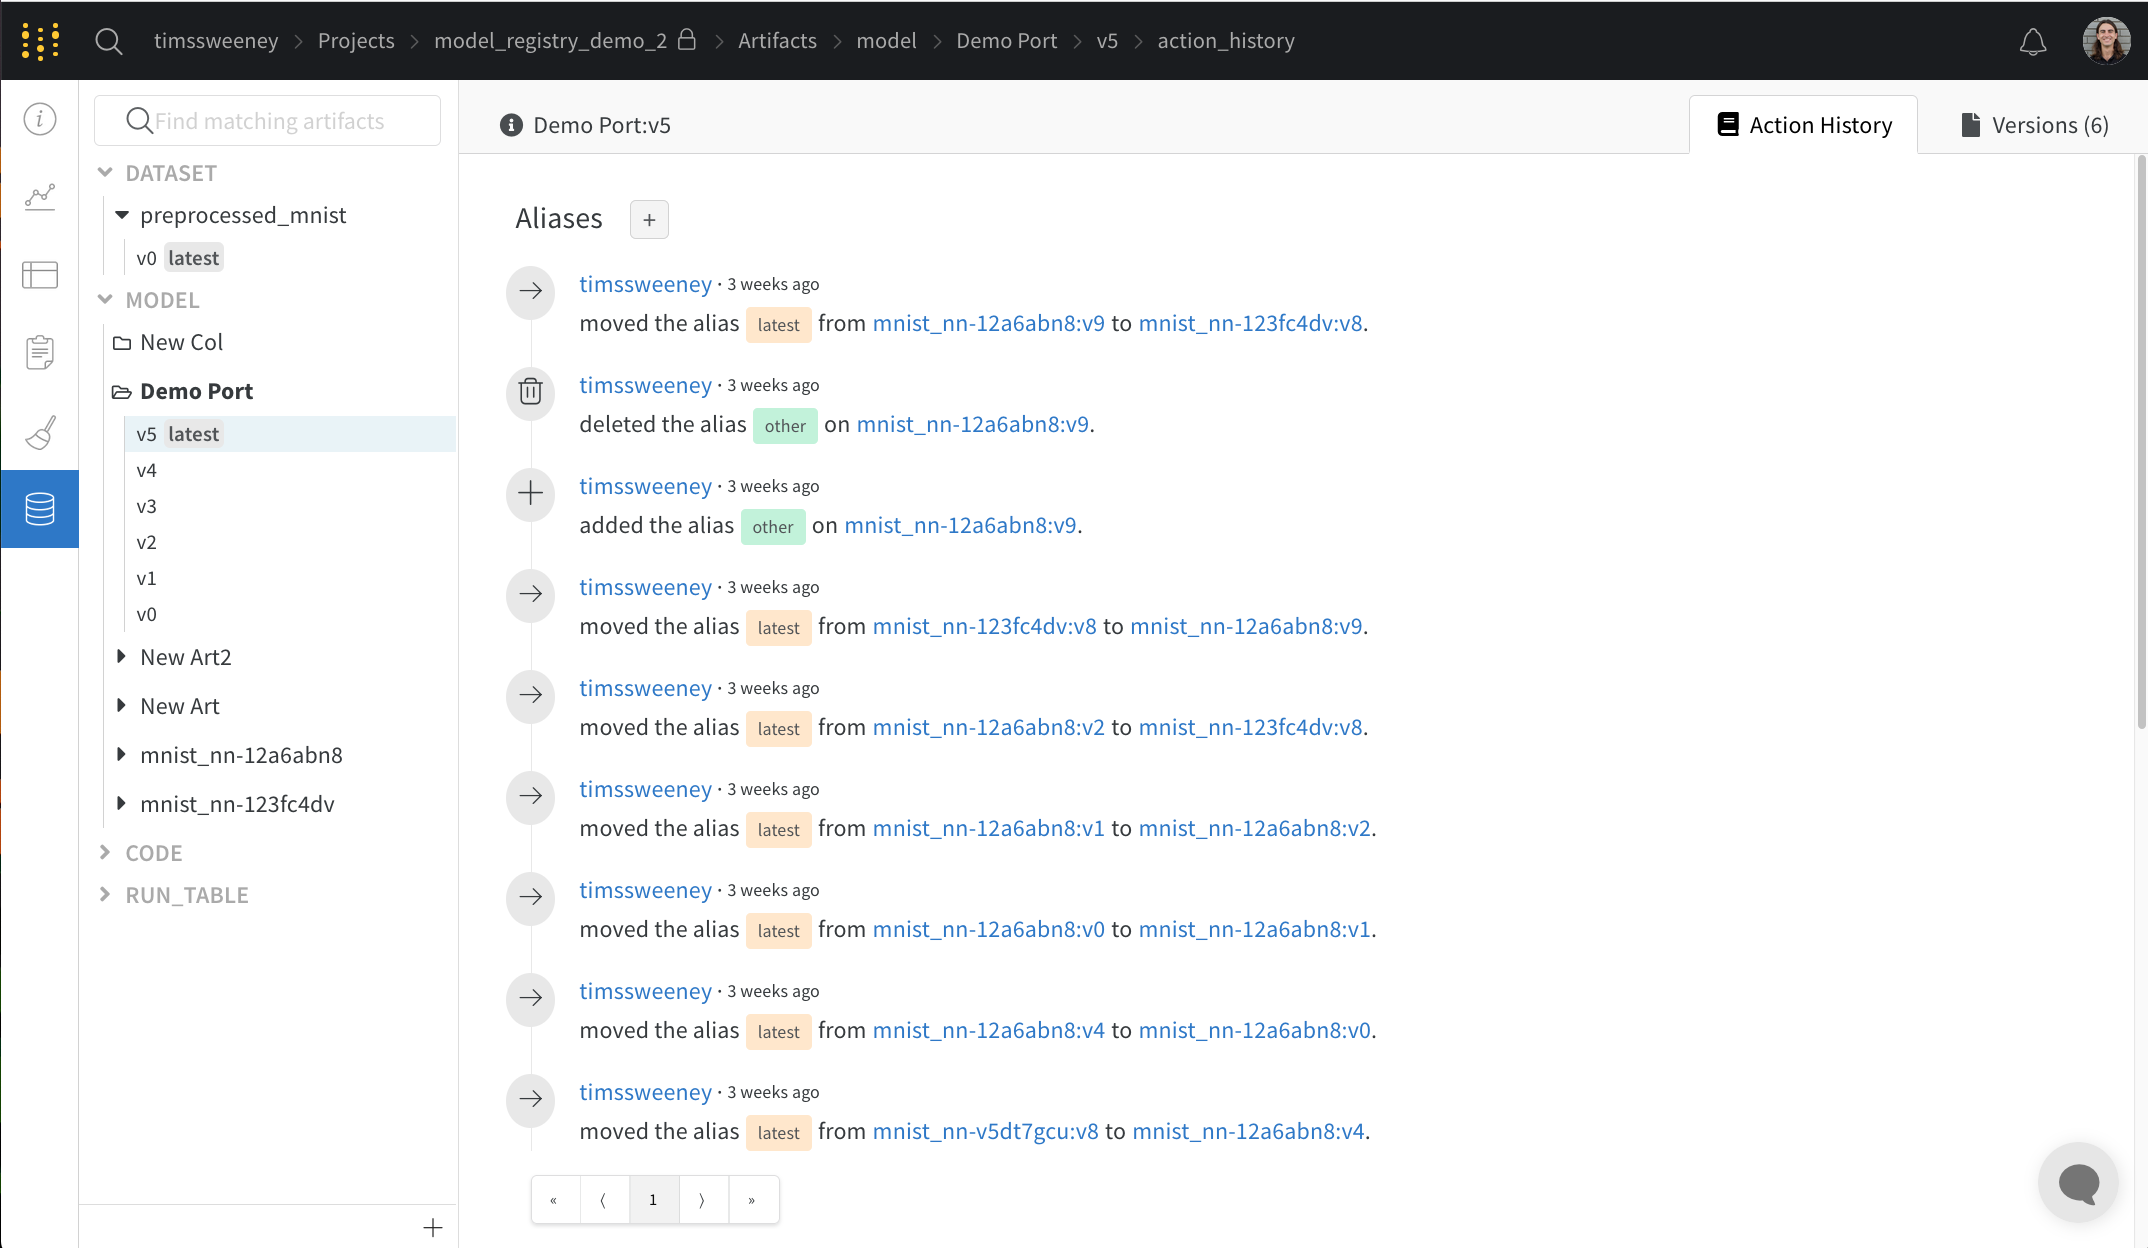
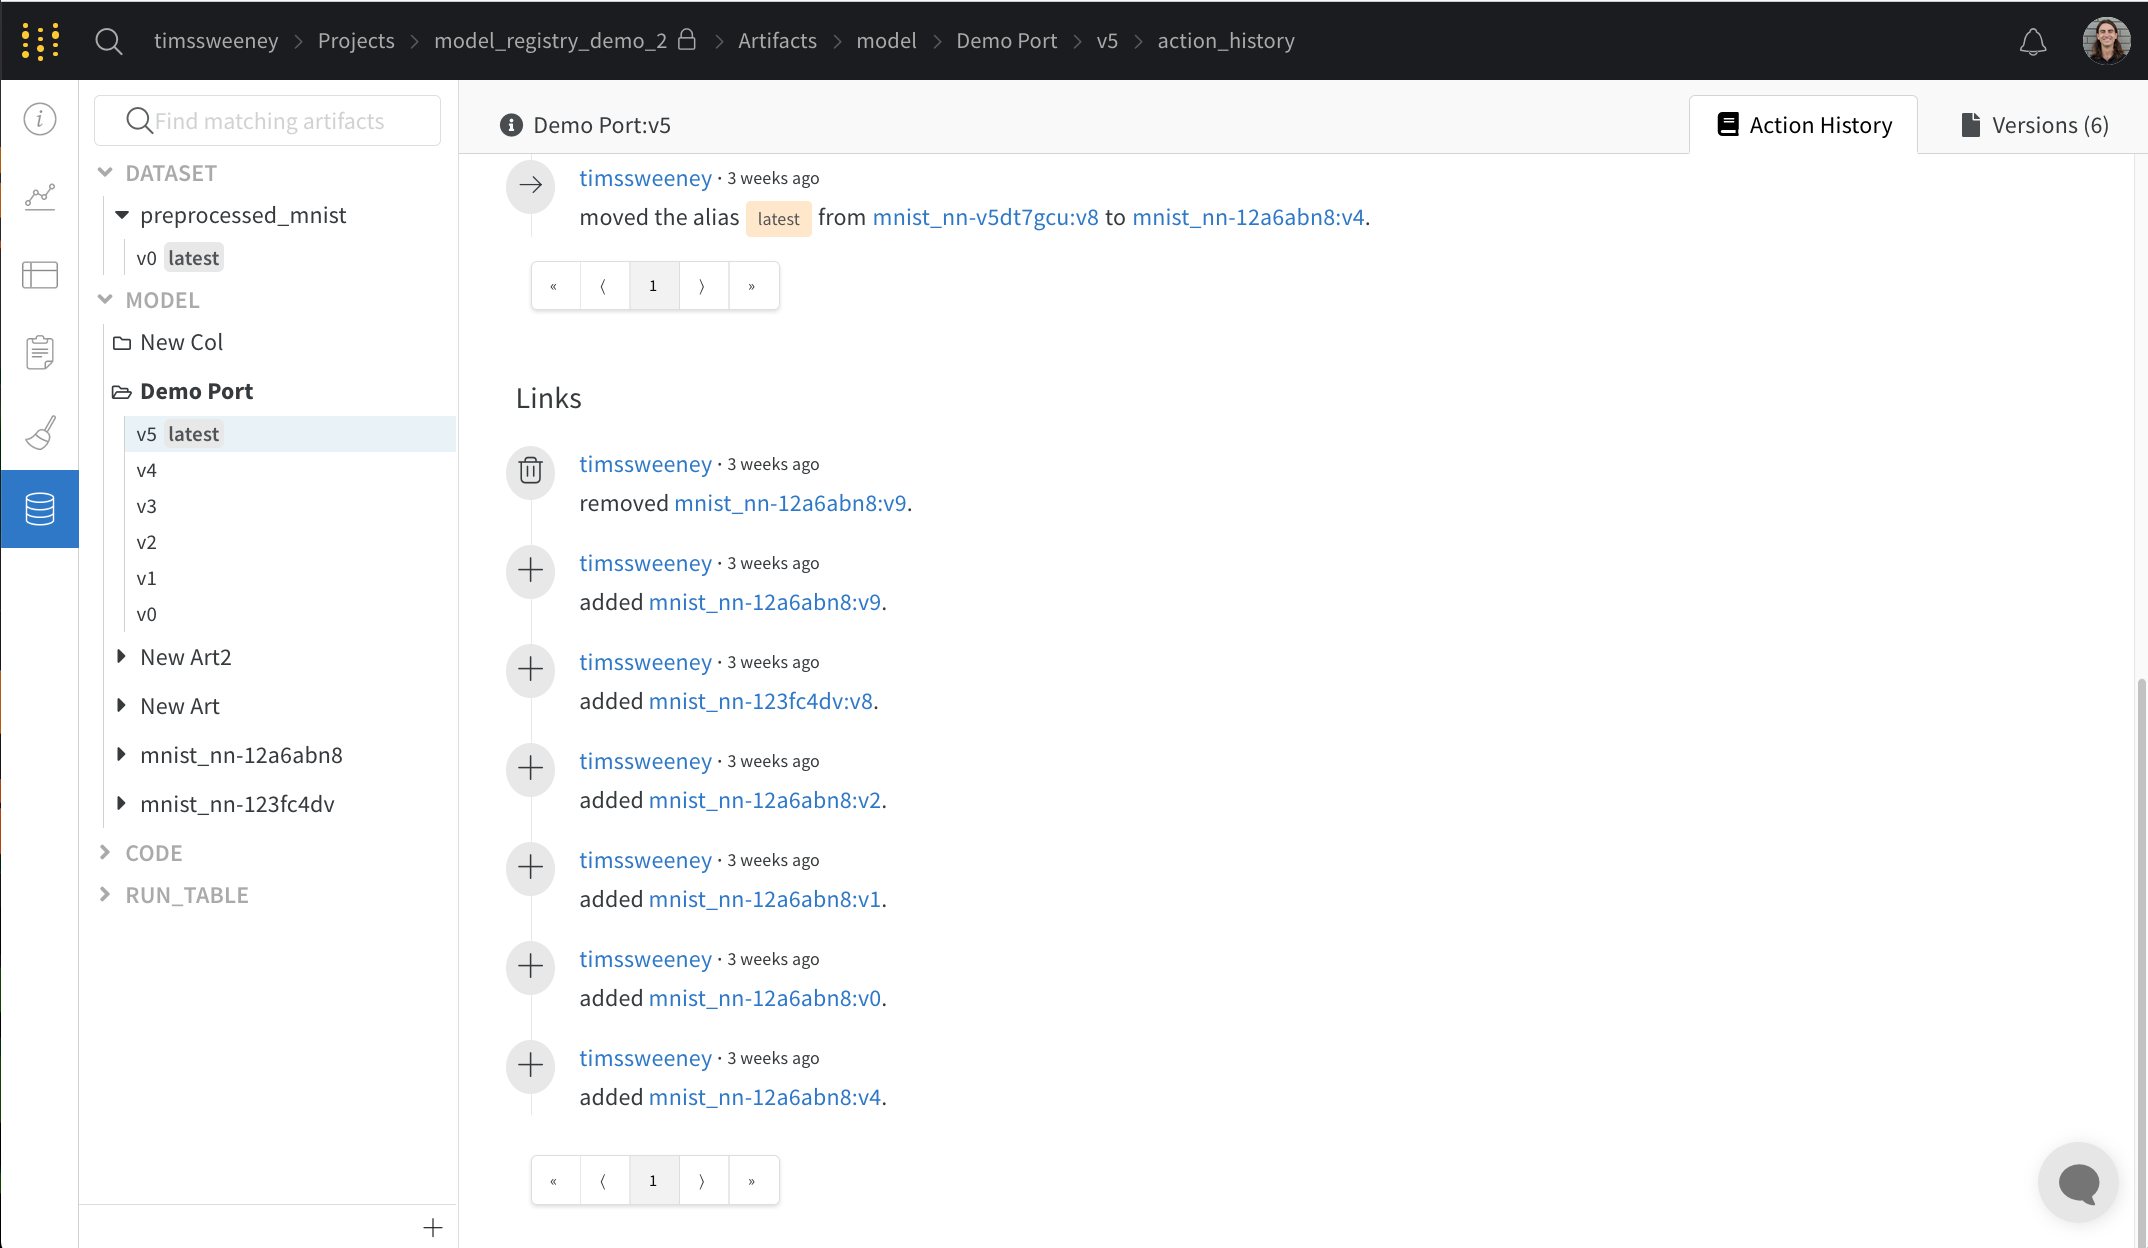
The action history audit tab shows all of the alias actions and membership changes for a Collection so you can audit the entire evolution of the resource.
Versions tab
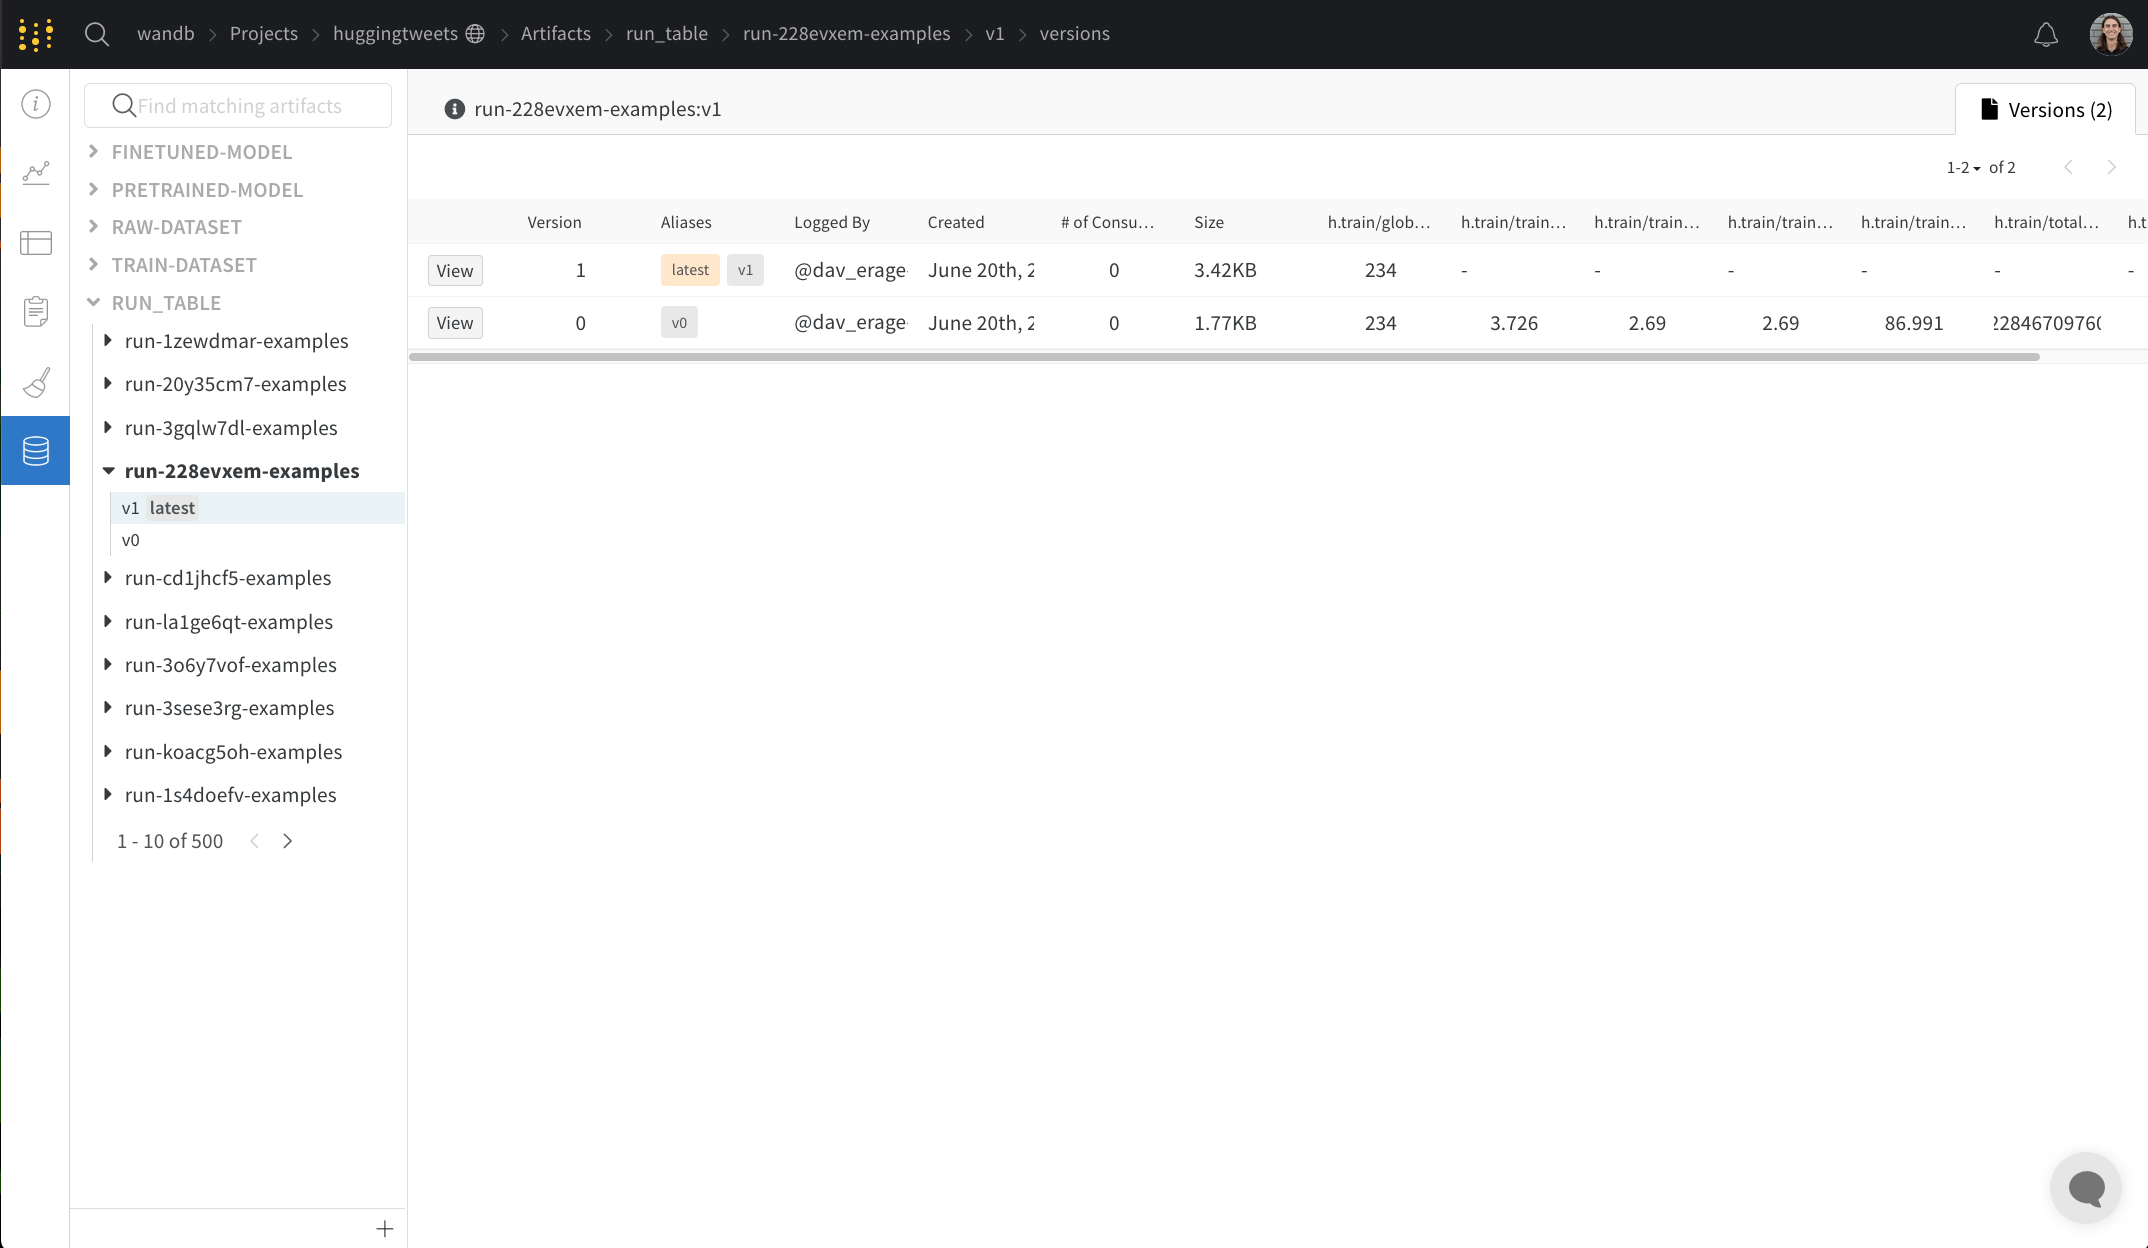
The versions tab shows all versions of the artifact as well as columns for each of the numeric values of the Run History at the time of logging the version. This allows you to compare performance and quickly identify versions of interest.
Frequently Asked Questions
How can I delete projects?
You can delete your project by clicking the three dots on the right of the overview tab.
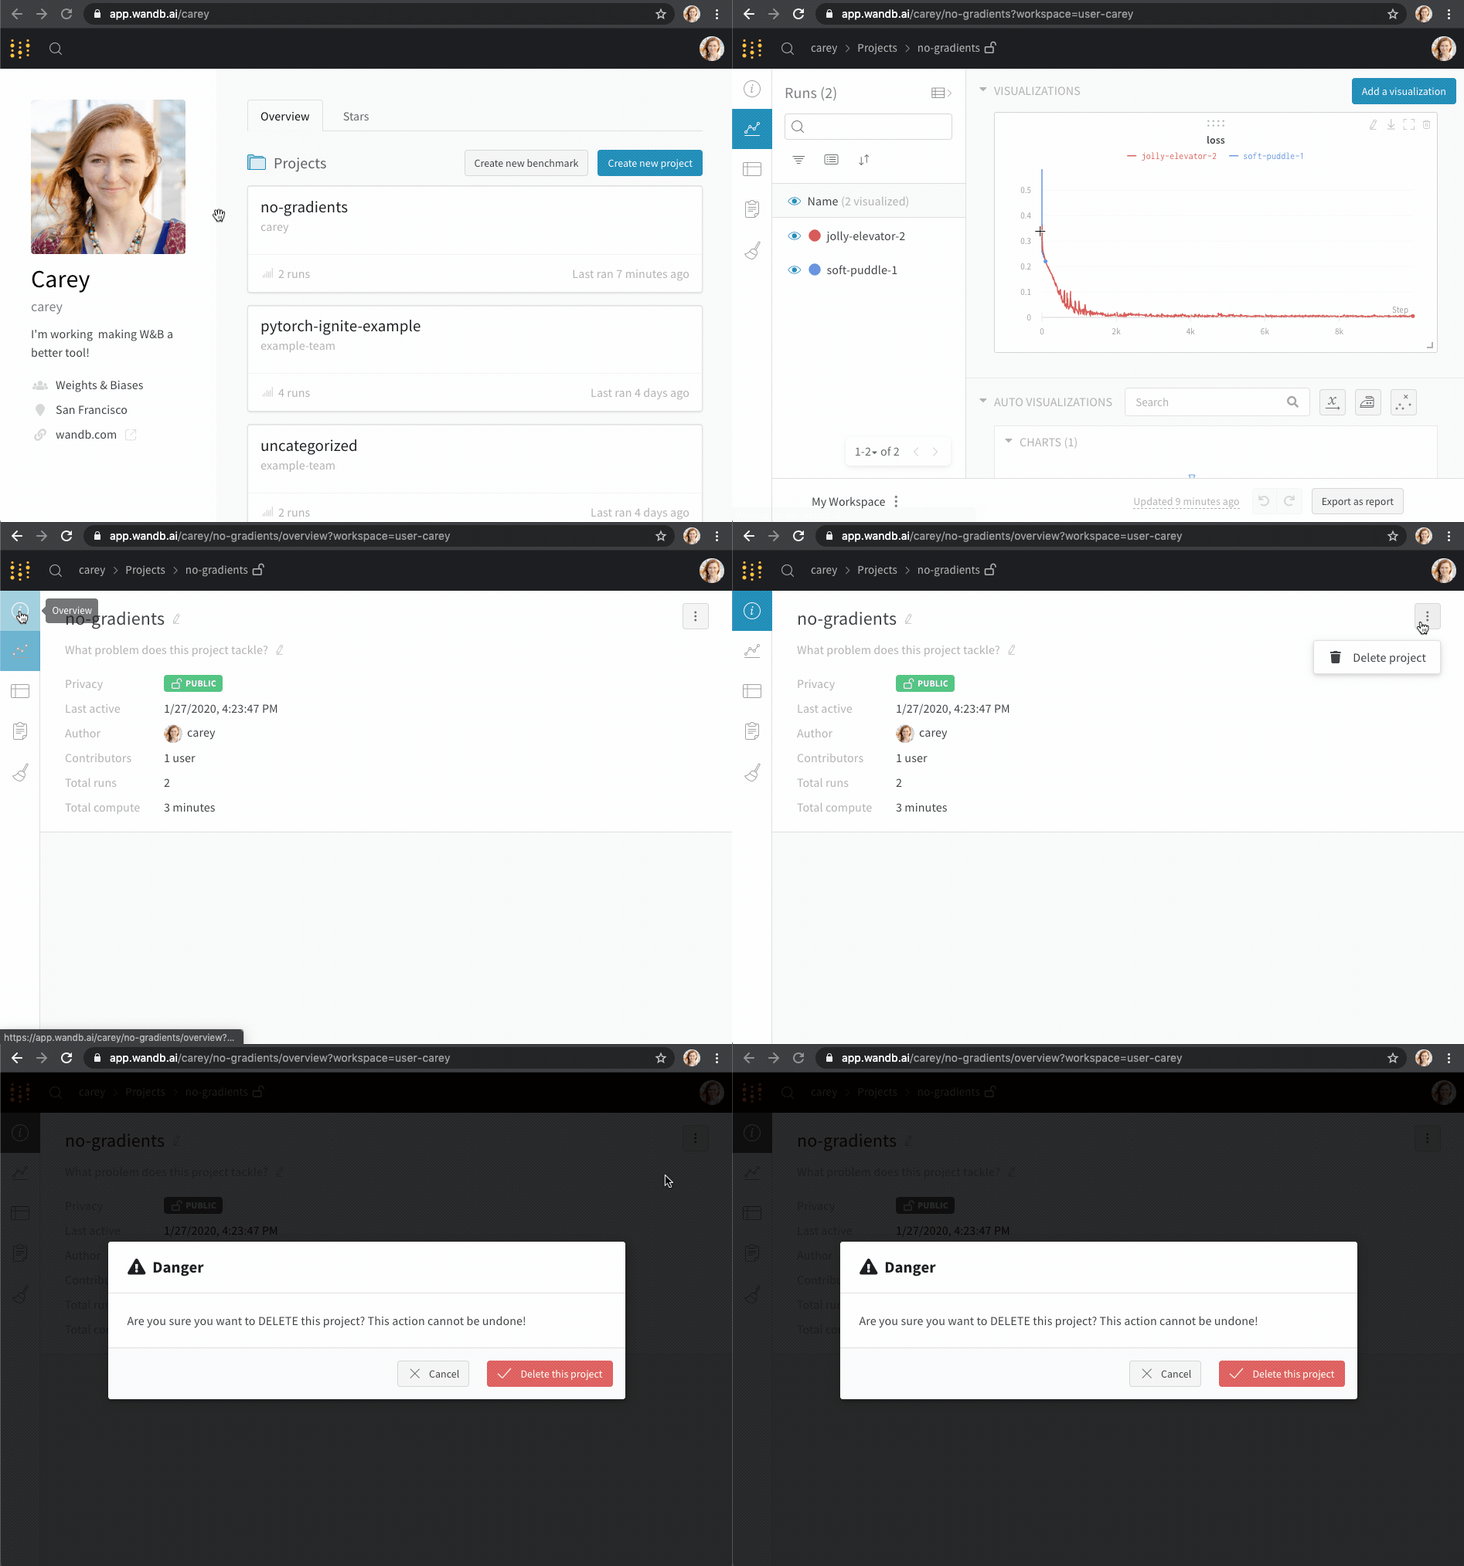
If the project is empty (i.e. it has no runs), you can delete it by clicking the dropdown menu in the top-right and selecting "Delete project".
Where are the privacy settings for projects? How can I make a project public or private?
Click the lock in the navigation bar at the top of the page to change project privacy settings. You can edit who can view or submit runs to your project. These settings include all runs and reports in the project. If you'd like to share your results with just a few people, you can create a private team.
How do I reset my workspace?
If you see an error like the one below on your project page, here's how to reset your workspace."objconv: "100000000000" overflows the maximum values of a signed 64 bits integer"
Add ?workspace=clear to the end of the URL and press enter. This should take you to a cleared version of your project page workspace.