Panels
Use visualizations to explore your logged data, the relationships between hyperparameters and output metrics, and dataset examples.
Common Questions
I select dimensions on a parallel coordinates plot and it disappears
This is likely because you have dots in your config parameter names. We flatten nested parameters using dots, and we only handle 3 levels of dots in the backend. I recommend using a different character as a separator.
Visualize max accuracy in groups
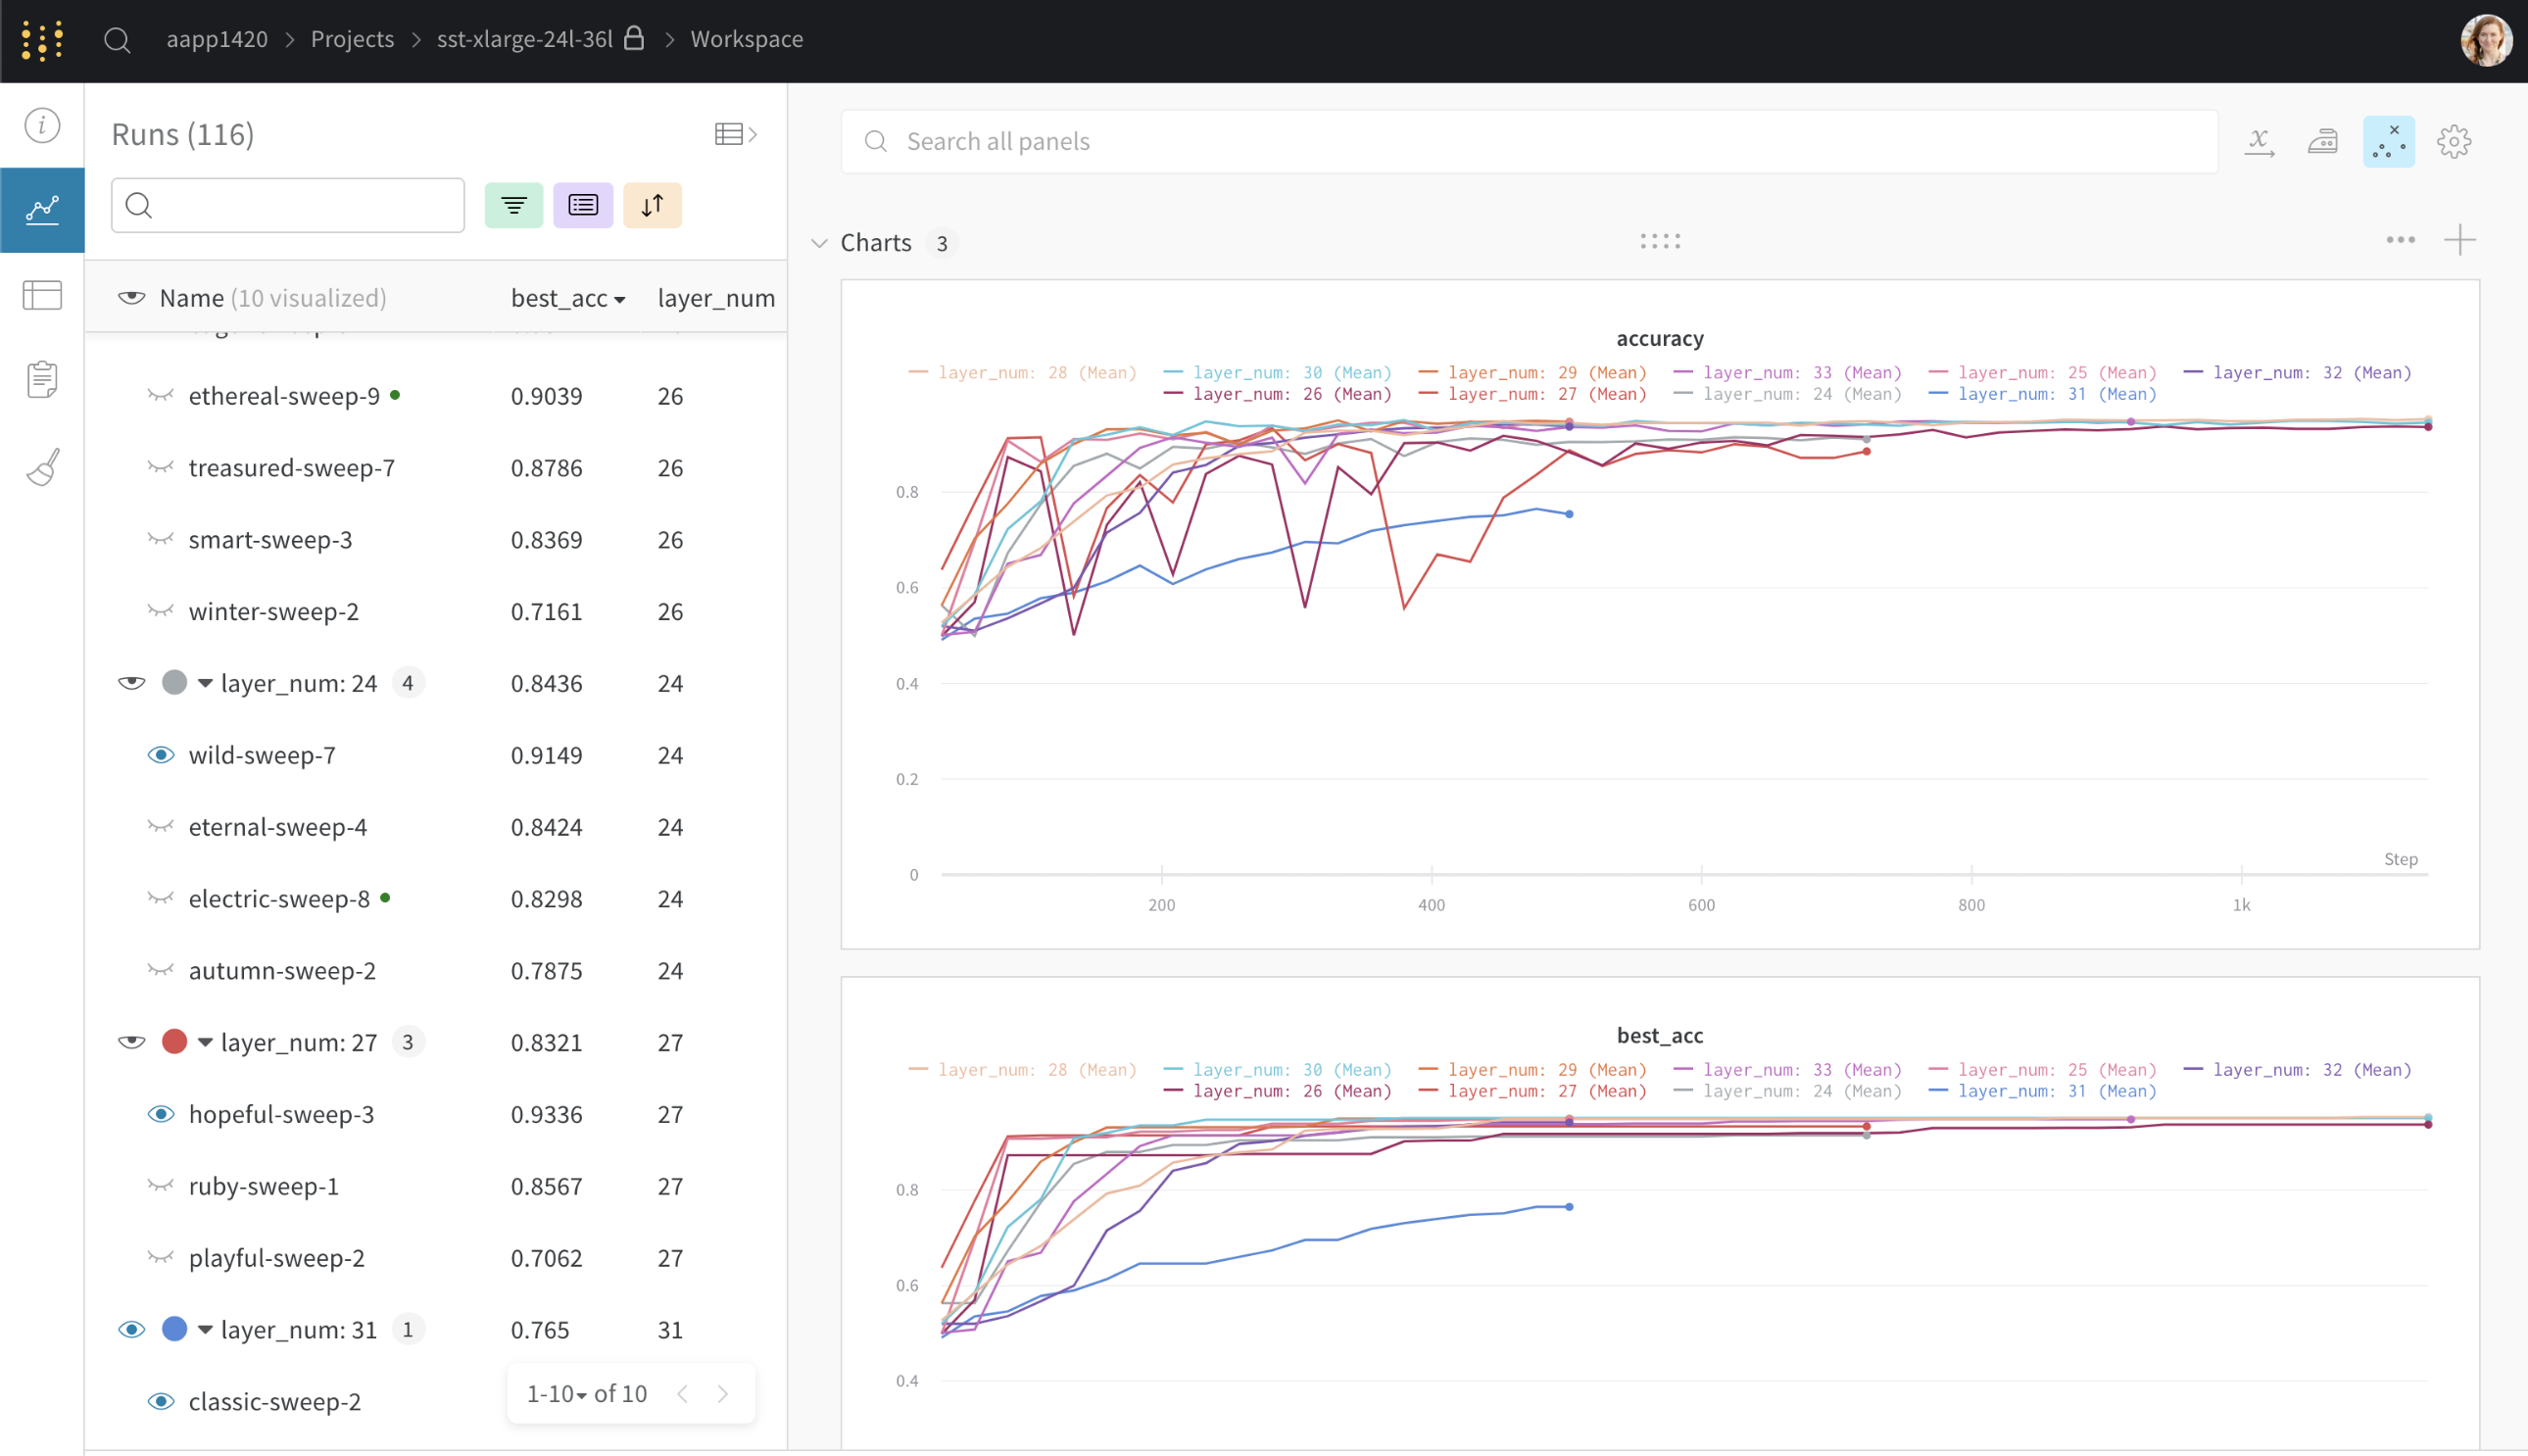
Turn on the "eye" icon next to the top run in each group to visualize the maximum accuracy on the charts

Download charts
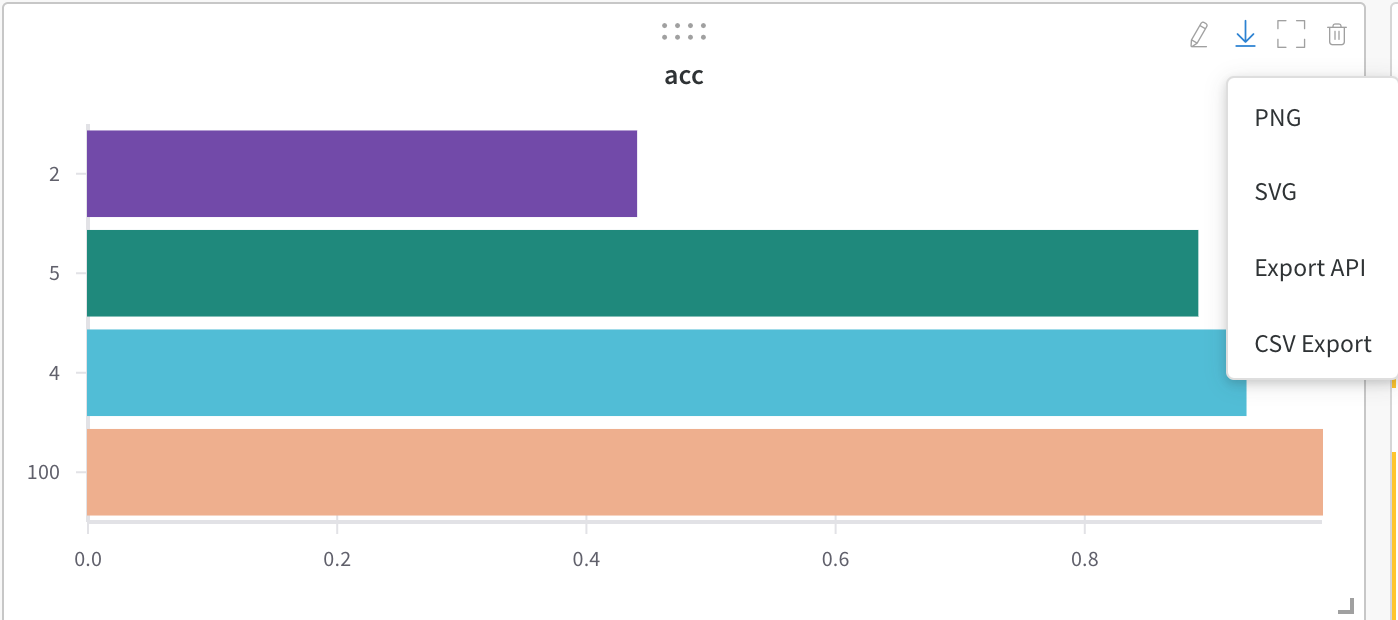
You can download charts by clicking the down arrow and select a format (.png, .svg, export API or export by CSV)
